
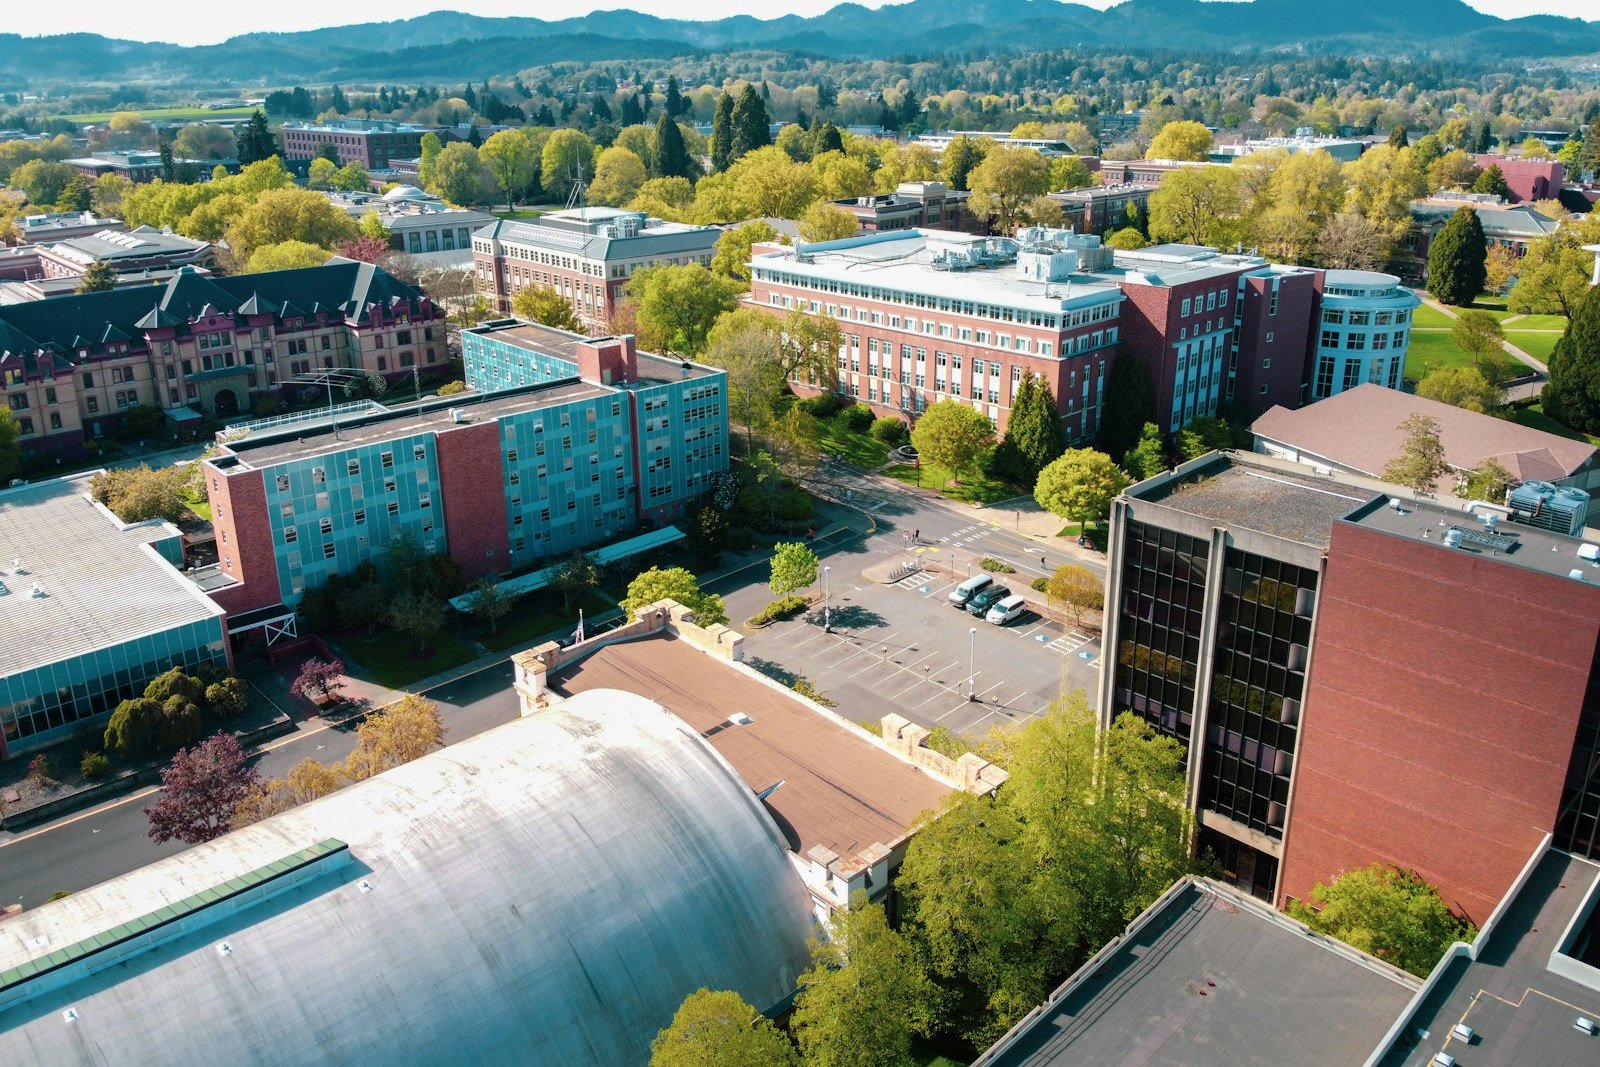
Campuses and classrooms with healthy air and bills that add up.
Campuses and school estates run dozens of buildings on small teams, with timetables that change every term. Aqueduct reads every building into one model, ranks the waste, and keeps classroom air in range.
What universities and schools teams are up against.
Water, energy, air and operations carry equal weight. Each one runs the same loop: monitor, measure, identify, act, verify.
Water: Residence halls and labs
Running fixtures across hundreds of rooms, found on the bill
Energy: Heating plant
Boilers heating empty buildings through breaks
Air: Classrooms and lecture halls
CO2 climbing in full rooms on fixed ventilation
Operations: Aging HVAC
Equipment past its life, failing in term time
Problem, solution, impact.
How Aqueduct resolves each problem for universities and schools, and what changes when it does.
Running fixtures across hundreds of rooms, found on the bill
A live water balance across meters and sub-meters localizes the loss, routes the fix and confirms it closed at the meter.
Loss found from the balance, not the bill, and every fix verified.
Boilers heating empty buildings through breaks
Weather-normalized baselines per building and asset show the waste in money; schedules and setpoints adjust where control is enabled.
Savings stated in money and confirmed at the meter, not estimated.
CO2 climbing in full rooms on fixed ventilation
Air quality per zone, overlaid with occupancy, with ventilation raised when it matters and verified back in range.
Targets held during occupied hours, with the energy cost counted.
Equipment past its life, failing in term time
Faults diagnosed in plain language and routed into your CMMS with the fix; early signs of failure schedule maintenance first.
Fewer reactive call-outs and closures confirmed by the equipment.
One incident, from first signal to verified fix.
An illustrative example of the flywheel on a typical site.
Buildings, meters and timetables read into one model.
A baseline per building and term.
Room 214 CO2 above 1,100 ppm by mid morning.
Alert to estates naming the room and its AHU.
CO2 back in range. Record kept for the term.
Four connected products on one data layer.
Replace what should be replaced. Connect the rest.
- BMS and BAS
- EMS
- Indoor air quality monitoring
- Leak and balance tools
- CMMS
- Timetabling as an input
Three equal ways in: keep your BMS, replace it, or build Aqueduct in at design stage.
The questions each seat asks first.
“Can a small team run this?”
“Where do our rating numbers come from?”
“What does it take off the utility bill?”
Standards and regulations we supply evidence for.
We supply the measured inputs. You run the program and file the report.
The state of school and campus buildings.
of US school districts need HVAC updates in at least half their schools.
Source: GAO-20-494, 2020spent on energy by US K-12 districts each year.
Source: ENERGY STAR, K-12 schoolsof US commercial building energy is used by education buildings.
Source: EIA CBECS, educationClassroom air rules with dates.
| Rule or standard | Date | What it asks for |
|---|---|---|
| France school ventilation decree | From 1 January 2023 | Annual ventilation check with a direct CO2 reading |
| California CalSHAPE | Grant condition | Classroom CO2 monitors that alert above 1,100 ppm |
| ASHRAE 241 | Published 2023 | Equivalent clean airflow per occupant in risk periods |
Repairs are overdue and funding has changed.
An HVAC backlog
GAO estimated about 36,000 schools need HVAC updates. Ranking buildings by measured condition decides which go first.
Direct pay for public owners
School districts and public universities can receive clean energy credits as direct payments under elective pay.
Proven in live sites across sectors.
Anonymized results from live sites.
sites in 21 countries run on Aqueduct.
and 9 clinics in one of India’s top hospital chains.
US airport running water intelligence on Aqueduct.
of commercial real estate under Aqueduct.
Features that matter here
Common questions
Yes. Findings arrive ranked by cost and room impact, so a team of a few people works the top of the list rather than every alarm. Each finding names the building, the equipment and the likely fix, and closes only when a meter or sensor confirms it.
Yes. aQ AirSafe logs CO2 per classroom against the threshold you set and keeps the record for each term. Exposure is counted in zone-hours of occupied time, so a room that peaks briefly is told apart from one that stays high all afternoon. See CO2 monitoring.
By setting each building schedule to the academic calendar and checking it against what actually runs. Aqueduct baselines every building on weather and term dates, flags plant running through holidays and prices the waste, so the estates team fixes the costliest buildings first.
Yes. Aqueduct tracks fault frequency, run hours and energy intensity per building and asset, so capital requests rest on measured condition rather than age alone. Buildings with repeat faults and rising use move up the list. See capital planning with condition data.
See Aqueduct on your own facility.
Bring a site, a utility bill or a question. We will show you where the loss is.