
ESG data for building sustainability reporting, from meters instead of invoices
Disclosure frameworks now ask for water and energy detail that invoices cannot supply: consumption in water-stressed areas, reuse, discharge, intensity per site. Aqueduct supplies metered, weather-normalized data per site, exported by reporting period.
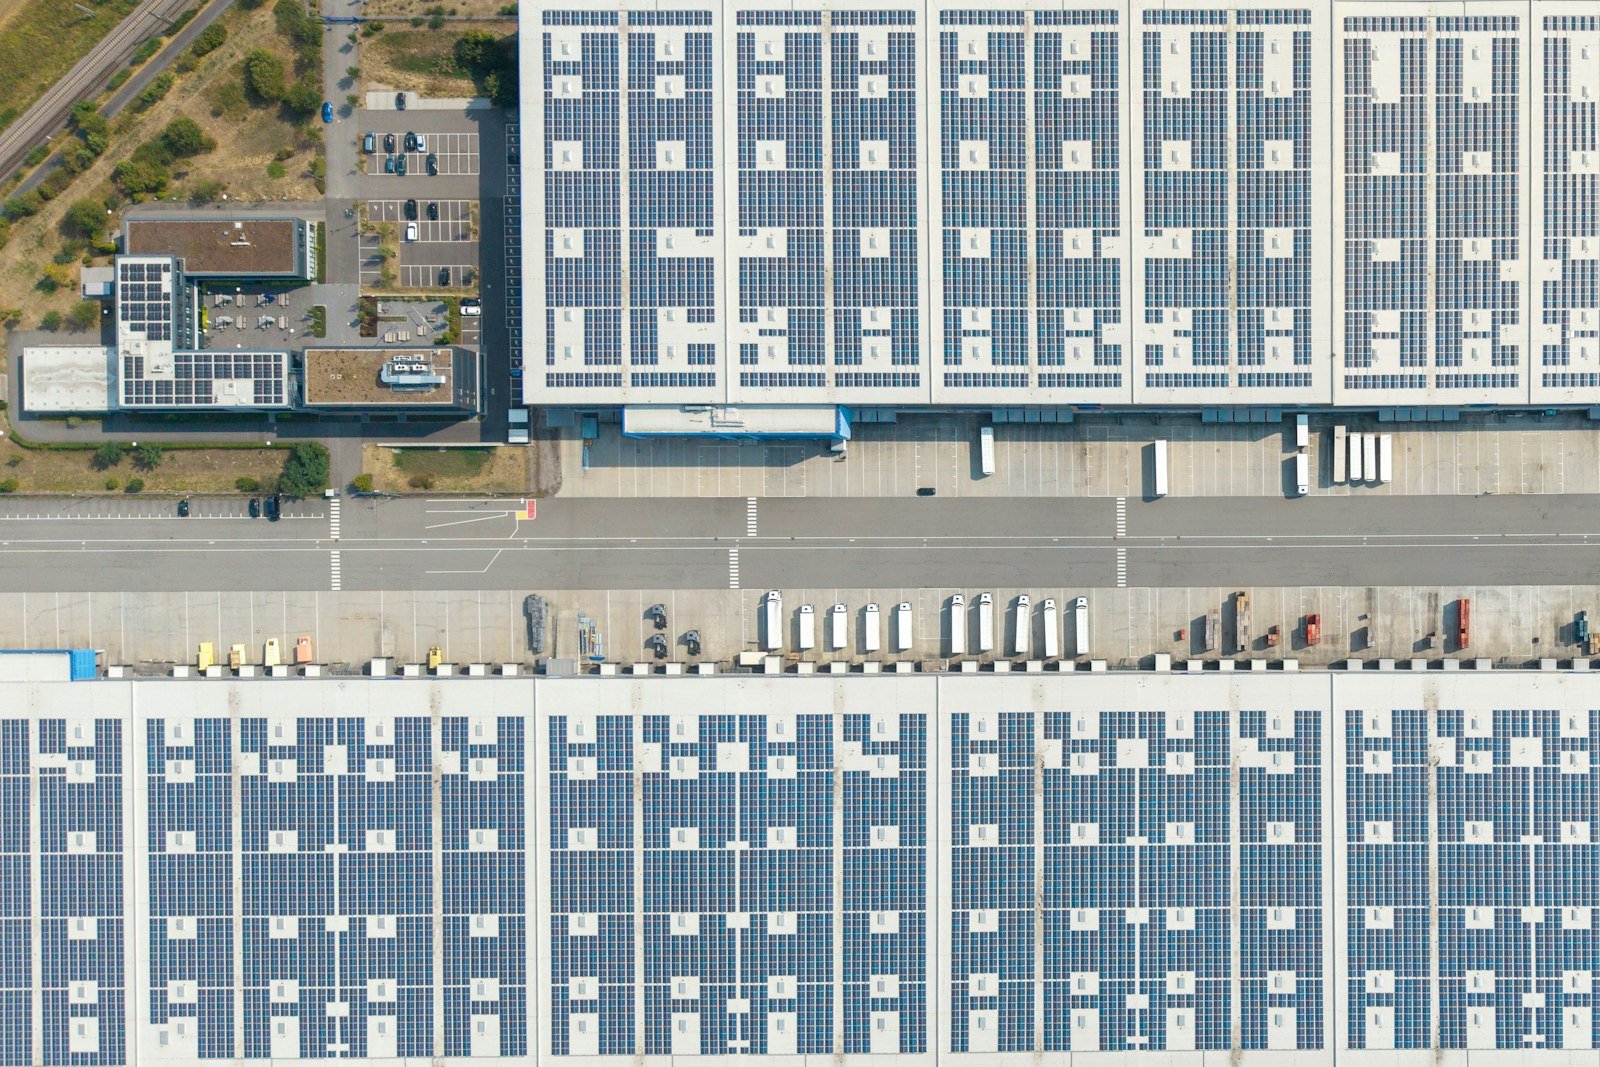
Reporting data is only as good as the meter behind it.
Why building ESG data is weak
- Invoice totals
Bills give one figure per account, with no split by use, building or source.
- Estimates and gaps
Missing months are filled with estimates that auditors question.
- Weather noise
A mild year looks like progress and a hot one looks like failure.
What reporting now asks for
revised ESRS E3 asks for consumption, consumption in water-stressed areas, withdrawal, discharge, recycling and storage.
Source: EFRAG, ESRS E3per metric ton of CO2e over the limit: the NYC Local Law 97 penalty for covered buildings.
Source: NYC Department of Buildingsof global CO2 emissions come from buildings and construction.
Source: UNEP GlobalABC 2024/2025From meter to filed report
Meter what is reported
Withdrawal, reuse, discharge and energy by source are metered rather than derived from bills.
Normalize
Baselines remove weather, so year-on-year change reflects operations.
Convert
Energy is converted to carbon with the grid factor, source and year recorded.
Export by period
Data exports per site and reporting period, with meter coverage shown so gaps are visible.
Data points reviewers ask about
| Metric | What it tells you | Act when |
|---|---|---|
| Metered coverage per site | How much of the figure is measured | Coverage falls below your audit threshold. |
| Water in water-stressed areas | ESRS E3 exposure | A stressed site's use rises. |
| Recycled and reused volume | Reuse claims backed by meters | Reuse flow drops. |
| Emissions against limit | Penalty exposure under local laws | The forecast passes the limit. |
sites in 21 countries run on Aqueduct.
and 9 clinics in one of India’s top hospital chains.
US airport running water intelligence on Aqueduct.
of commercial real estate under Aqueduct.
FMCG manufacturing campus.
operations run on Aqueduct.





Related
Common questions
No. Aqueduct hands over the measured figures. Your team or consultant prepares and files the disclosure, with each figure traceable to a meter, a period and a coverage figure. See CSRD.
CSRD and ESRS, GRESB, CDP, ENERGY STAR Portfolio Manager, Local Law 97 and similar benchmarking laws. The same metered data serves each one, so figures stay consistent across disclosures. See GRESB.
Main meters or uploaded bills give site totals and a baseline in Aqueduct. Sub-meters later add the split by use and source that frameworks increasingly ask for. See load disaggregation.
Metered kWh is multiplied by the site's grid emission factor for each period. The factor shown beside the figure lets an assurer check the conversion against the published grid data. See for sustainability leads.
See Aqueduct on your own facility.
Bring a site, a utility bill or a question. We will show you where the loss is.