
HVAC&R monitoring and control, from the chiller plant to the cold room
Chillers, towers, air handlers, compressors and cold rooms fail and waste energy in ways a BMS alarm rarely catches. Aqueduct tracks efficiency, faults and temperature excursions per machine, using the meters and controllers already on site.
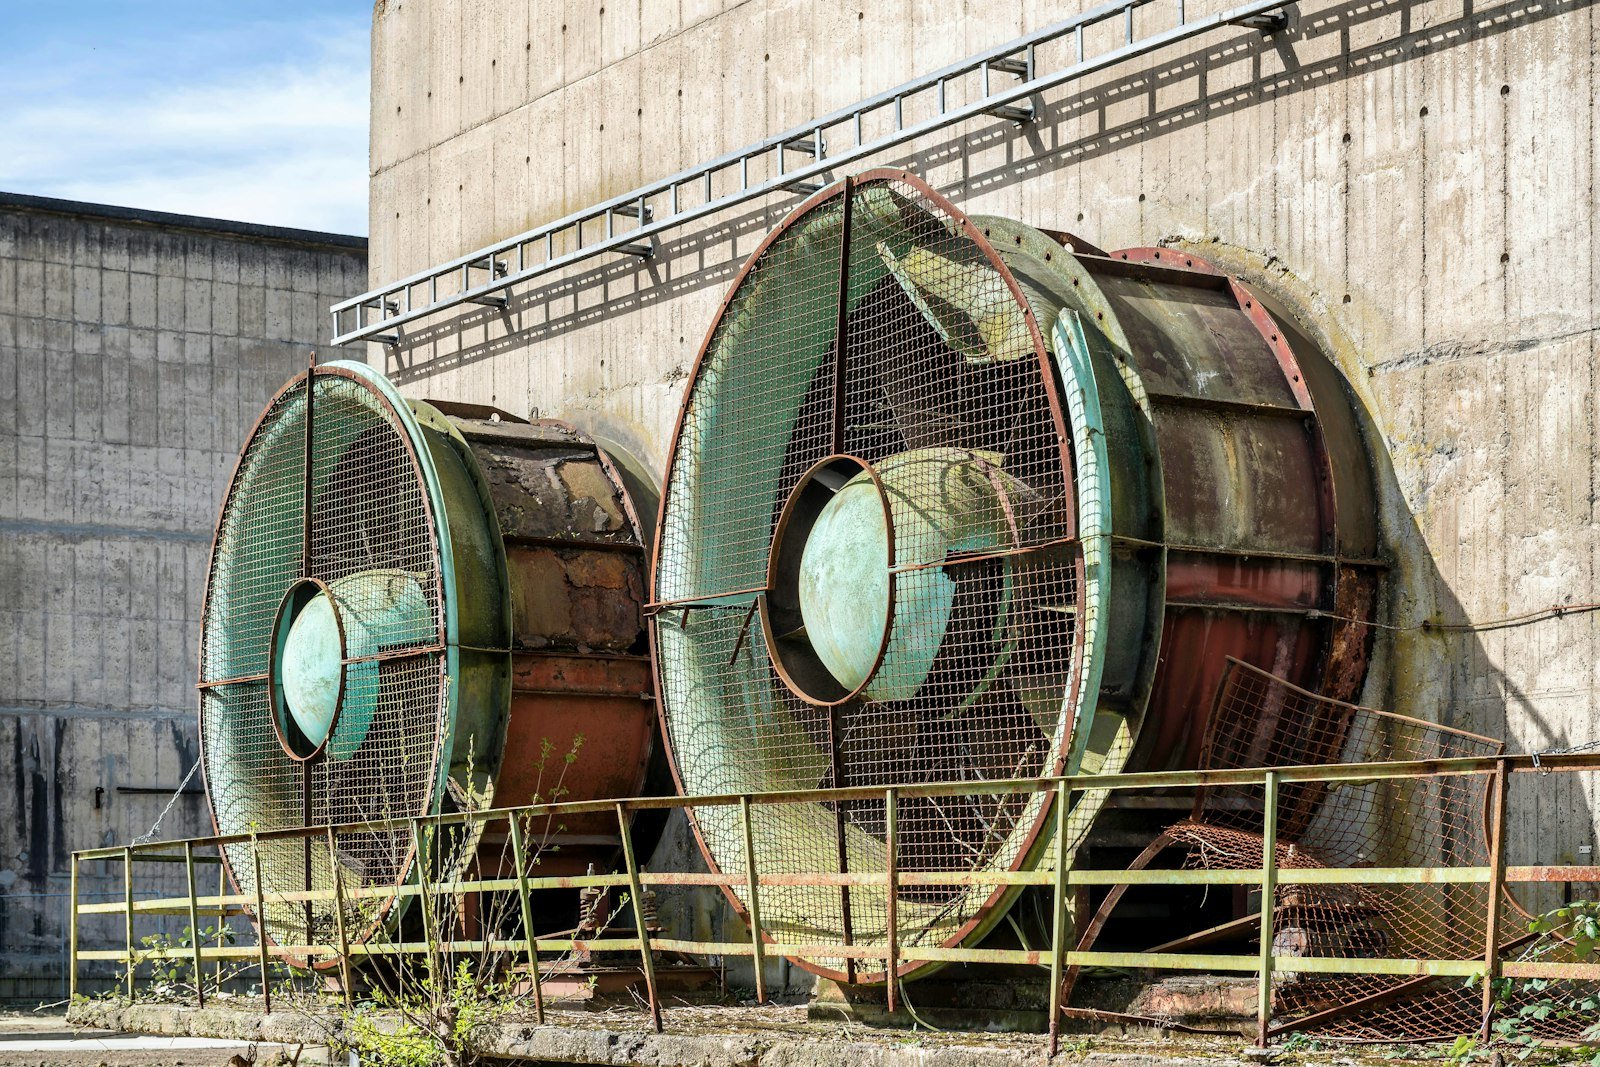
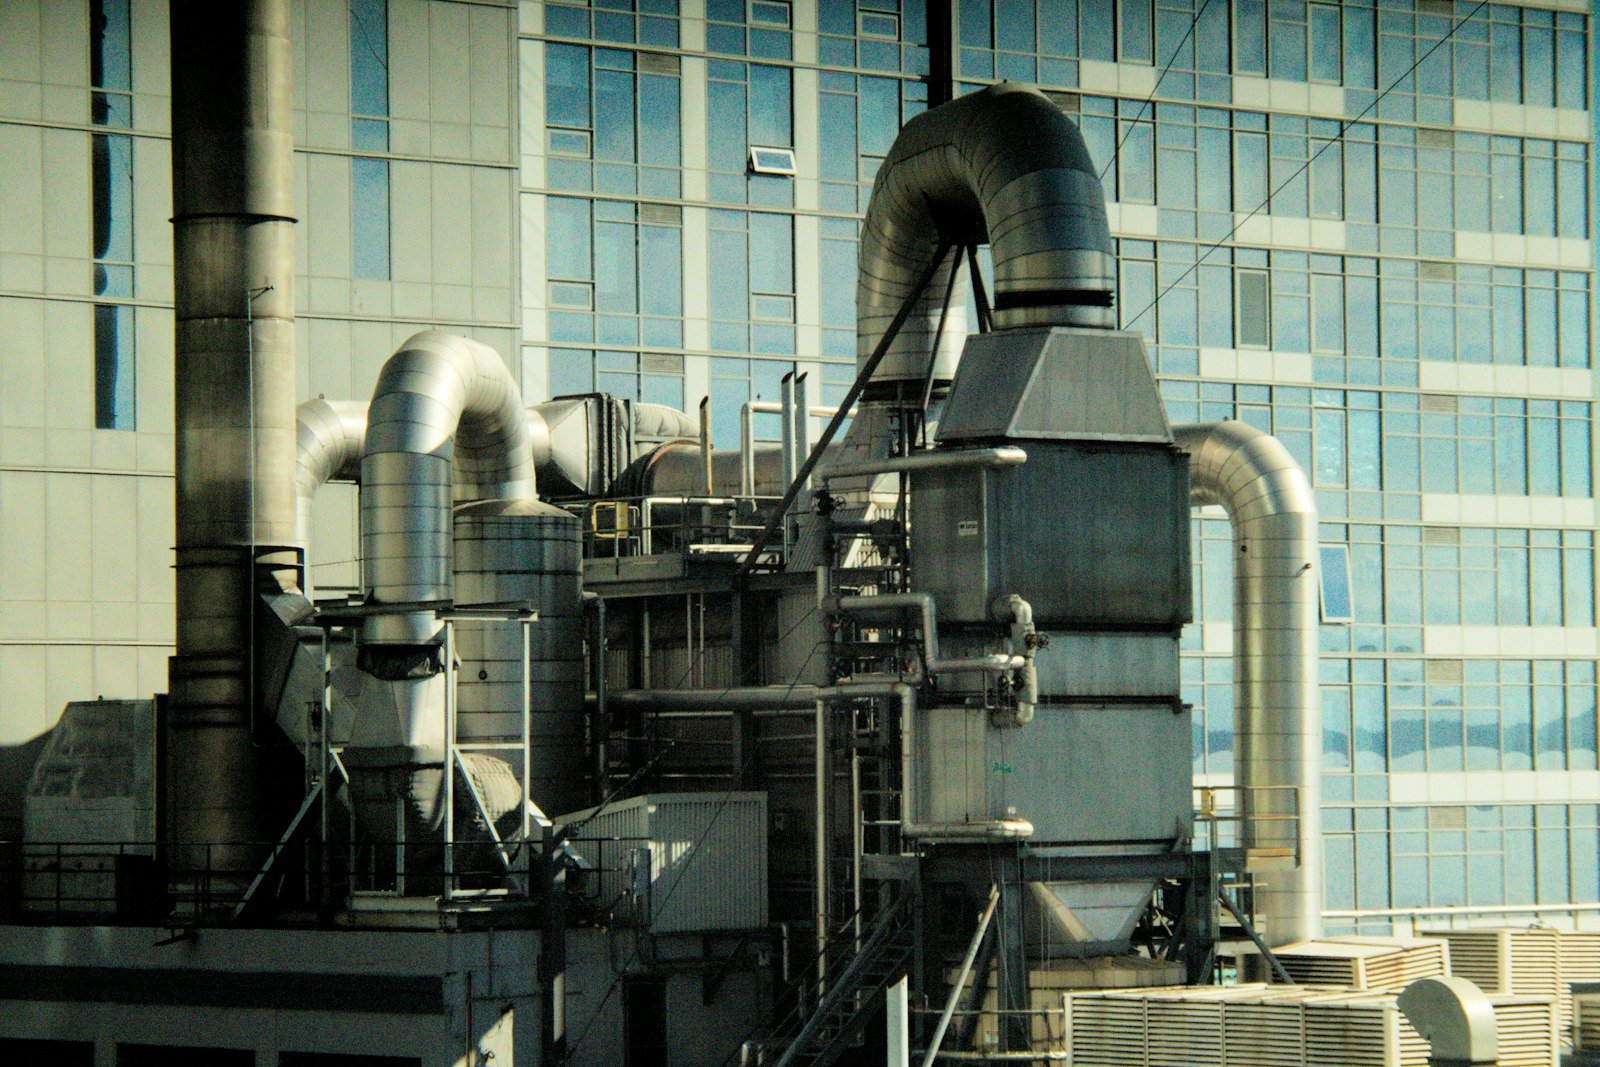
Every compressor and cold room measured against its own normal.
From alarms to early warnings
- Efficiency per machine
kW per ton and energy per unit of cooling, tracked continuously instead of at the annual service.
- Drift before failure
Vibration, discharge pressure and energy trends raise a maintenance alert before a trip.
- Excursions with context
A cold room breach is shown alongside the plant serving it, so the cause is clear.
HVAC&R equipment Aqueduct covers, and what is measured
Existing meters, BMS points and controllers are read where they exist. New sensors go in only where the site is blind.
| Equipment | Metered and sensed | What Aqueduct derives |
|---|---|---|
| Chillers and chilled water plant | Feeder kW and kWh, BTU meter flow and header temperatures, run, trip and auto or manual state | kW per ton, coefficient of performance, delta T, runtime balance. |
| Cooling towers | Make-up water flow, TDS and pH, condenser water temperatures | Make-up use and water quality trends, approach where wet bulb is measured. |
| AHUs and RTUs | Supply and return air temperature, return humidity, valve and damper position, fan status, filter alarm | Component states on the twin, command against feedback, setpoint attainment. |
| VAV boxes | Zone temperature, damper position and setpoints over BACnet or Modbus | Comfort compliance and the zones driving each reset. |
| Boilers and hot water | Heating status, hot water supply temperature, gas use in therms or cubic meters | Hot water reset opportunities and heating use against degree days. |
| Refrigeration compressors and condensers | Discharge pressure, temperatures, condenser water flow, matched electrical input, vibration | Energy per unit of cooling, poor heat removal, early signs of failure. |
| Cold rooms | Room temperature and humidity | Excursions with time and duration, linked to the plant serving the room. |
Failure modes specific to HVAC&R plant
Low delta T
Chilled water returns too cold, so extra chillers and pumps run to move the same cooling.
Refrigerant loss
A slow leak lowers capacity and raises compressor run time long before a low-charge alarm.
Short cycling
Compressors and RTUs start and stop too often, wearing contactors and wasting energy.
Cold room excursions
Doors left open, failed fans or iced coils push product temperature out of range for minutes or hours.
Plant metrics worth a daily look
| Metric | What it tells you | Act when |
|---|---|---|
| Chiller plant kW per ton | Plant efficiency at each load band | It rises at the same load. |
| Chilled water delta T | Coil and valve health | It stays below design. |
| Compressor energy per unit of cooling | Charge loss, fouling or wear | It climbs week on week. |
| Cold room time out of range | Product risk, with duration | Any excursion passes your limit. |
| Compressor starts per hour | Short cycling | Starts exceed the maker's limit. |
From finding to audited command
Recommend first
Findings arrive with the data behind them, for your team or plant manager to act on.
Enable per asset
Control is switched on one machine and one strategy at a time, where control is enabled, with owner approval.
Protect the machine
Lockouts block a new command while one is in progress, so compressors do not short cycle.
Record the result
Command history shows each command and whether it executed, and savings are measured against that machine's baseline.
Refrigerant rules and leak rates make HVAC&R data a compliance issue
of refrigerant charge leaked each year in the average US supermarket, against 12.95% for GreenChill partners in 2011.
Source: US EPA GreenChill Progress Report 2011the US AIM Act phasedown of HFC production and consumption.
Source: US EPA final rule, Federal Register 2021HFCs will be phased out in the EU under the F-gas Regulation that applied from 11 March 2024.
Source: European Commission, F-gas Regulationsites in 21 countries run on Aqueduct.
and 9 clinics in one of India’s top hospital chains.
US airport running water intelligence on Aqueduct.
of commercial real estate under Aqueduct.
FMCG manufacturing campus.
operations run on Aqueduct.




Related
Common questions
No. Aqueduct reads the plant manager and BMS over BACnet or Modbus and adds per-machine analysis, maintenance alerts and, where enabled, supervisory commands. The existing sequences keep running the plant. See integrations.
Yes. Aqueduct logs cold room temperature and humidity continuously and records every excursion with its start time and duration, next to the refrigeration plant serving that room. See refrigeration and cold chain.
No. Aqueduct supplies the continuous temperature record and the excursion log that auditors ask for. Your quality team runs the program, signs off deviations and holds any certification. See compliance programs.
Aqueduct divides chiller electrical input from feeder meters by the cooling delivered, calculated from chilled water flow and supply and return temperatures. That gives kW per ton and coefficient of performance per machine, trended daily. See coefficient of performance.
See Aqueduct on your own facility.
Bring a site, a utility bill or a question. We will show you where the loss is.