
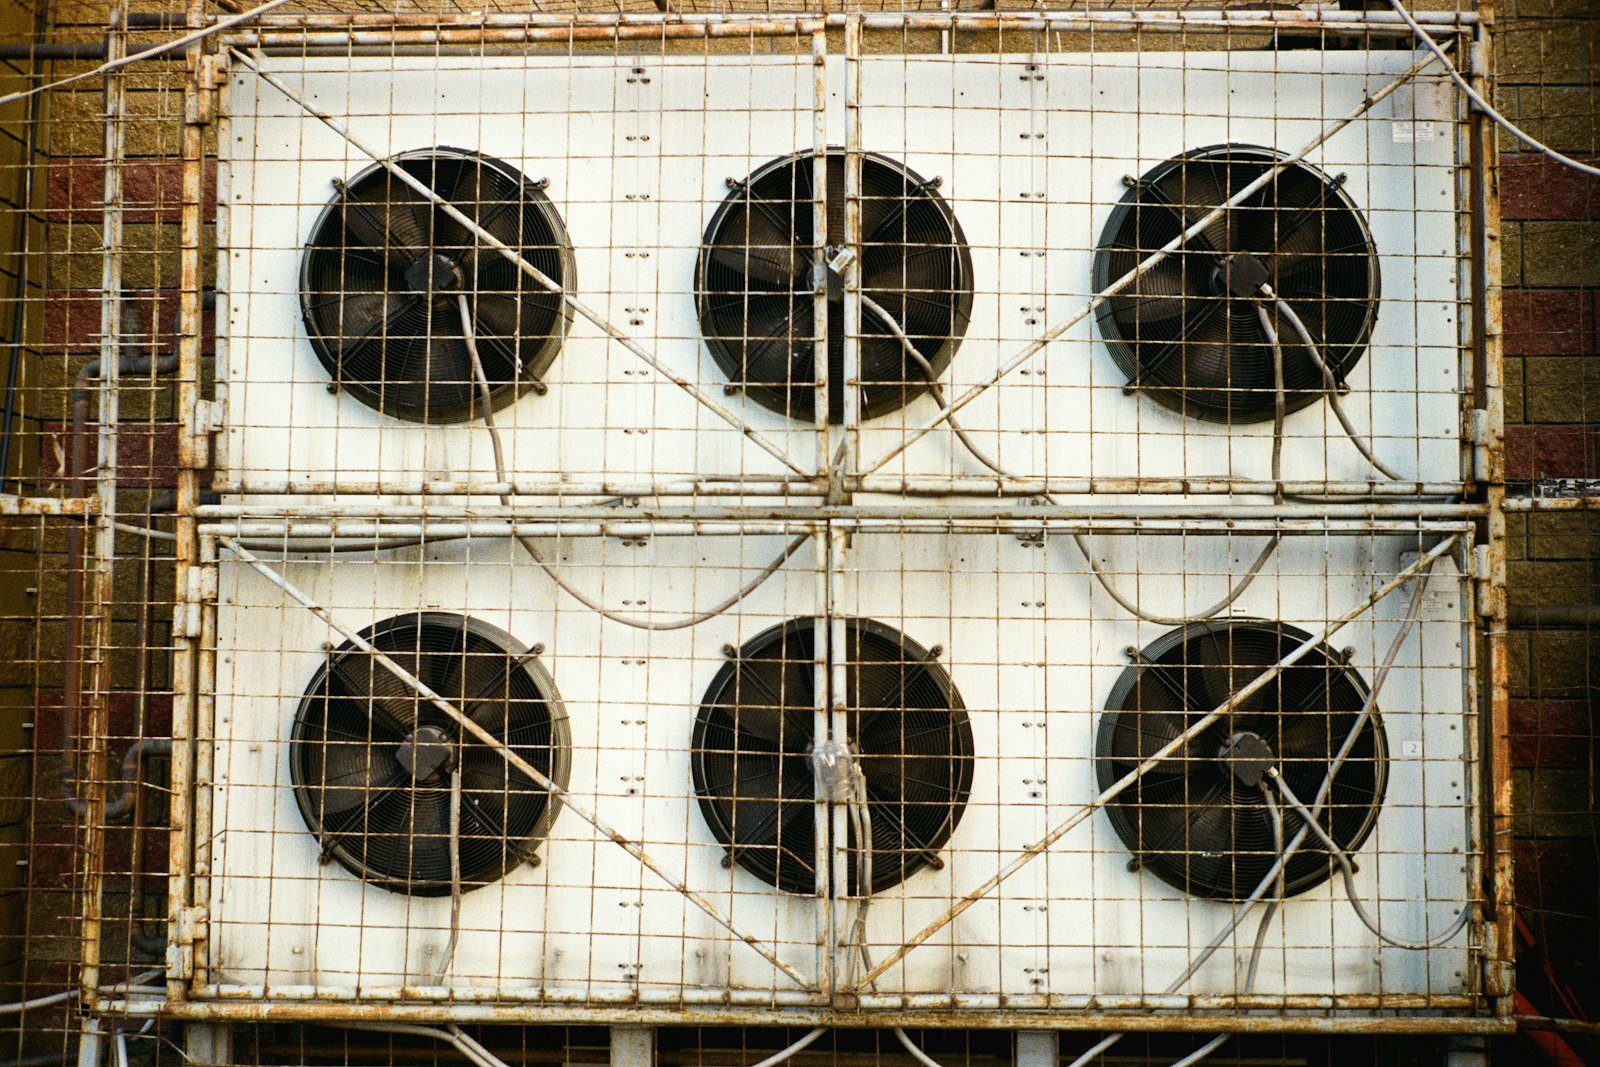
Dairy refrigeration monitoring, from the ammonia plant to the cold room
Dairy refrigeration monitoring means measuring every compressor, condenser, chiller and cold room against the cooling it actually delivers. Aqueduct reads pressure, temperature, condenser water flow and matched electrical input, works out kW per TR and COP under similar conditions, flags poor heat removal and early signs of failure, and keeps a continuous temperature record for every cold room and milk silo.
Where dairy refrigeration loses money quietly
Fouled condensers
Scale on the condenser or low condenser water flow pushes discharge pressure up, and every compressor works harder for the same cooling.
Compressors fighting each other
Several machines run part loaded instead of a few running well loaded, because sequencing was set once and never checked.
Efficiency nobody can state
The plant has nameplate figures, but nobody can say what a TR of cooling costs this week against last month.
Cold rooms checked by hand
A room drifts between rounds, and the record is a logbook entry instead of what actually happened.
What Aqueduct measures in a dairy refrigeration plant
| Equipment | Measured | What Aqueduct derives |
|---|---|---|
| Ammonia screw and reciprocating compressors | Suction and discharge pressure, discharge temperature, motor kW and kWh, run and load state, vibration | Energy per unit of cooling, load sharing across the group, early signs of failure |
| Evaporative condensers and cooling towers | Condenser water flow, inlet and outlet temperature, fan and pump power, make-up water | Heat removal performance and the pumping and fan energy that goes with it |
| Chillers, ice banks and glycol loops | Supply and return temperature, flow, BTU meter readings, ice bank level where fitted | Cooling delivered in TR, COP and kW per TR, ice build against the milk intake plan |
| Cold rooms and milk silos | Room and product temperature, humidity, door open time where sensed | Excursions with time and duration, linked to the plant group that serves the room |
What the numbers say.
of electricity to refrigerate one ton of dairy product.
Source: FAOSources1 references cited on this page
Related
Common questions
Yes. Aqueduct reads ammonia compressor, condenser and plant room data from existing SCADA, PLCs and meters, and adds sensing through partners where needed. The site safety system keeps control of ammonia alarms, ventilation and shutdowns, and Aqueduct keeps a shared record beside it.
Common causes include fouled condenser surfaces, low condenser water flow, poor cooling tower condition and non-condensable gases in the system. Aqueduct flags rising power and discharge pressure at flat cooling output and recommends condenser and cooling tower checks for the engineer to confirm.
Aqueduct keeps a continuous temperature record for each cold room and silo, with every excursion, its duration and its closure. Your quality team or auditor reviews and files that evidence. Aqueduct does not certify the cold chain.
Divide the electrical input of compressors, condenser fans and pumps by the cooling delivered, measured with flow and temperature or BTU meters. Aqueduct calculates it per refrigeration group under comparable conditions, so a rise points to fouling or poor sequencing rather than a hot day. See ton of refrigeration.
See Aqueduct on your own facility.
Bring a site, a utility bill or a question. We will show you where the loss is.