
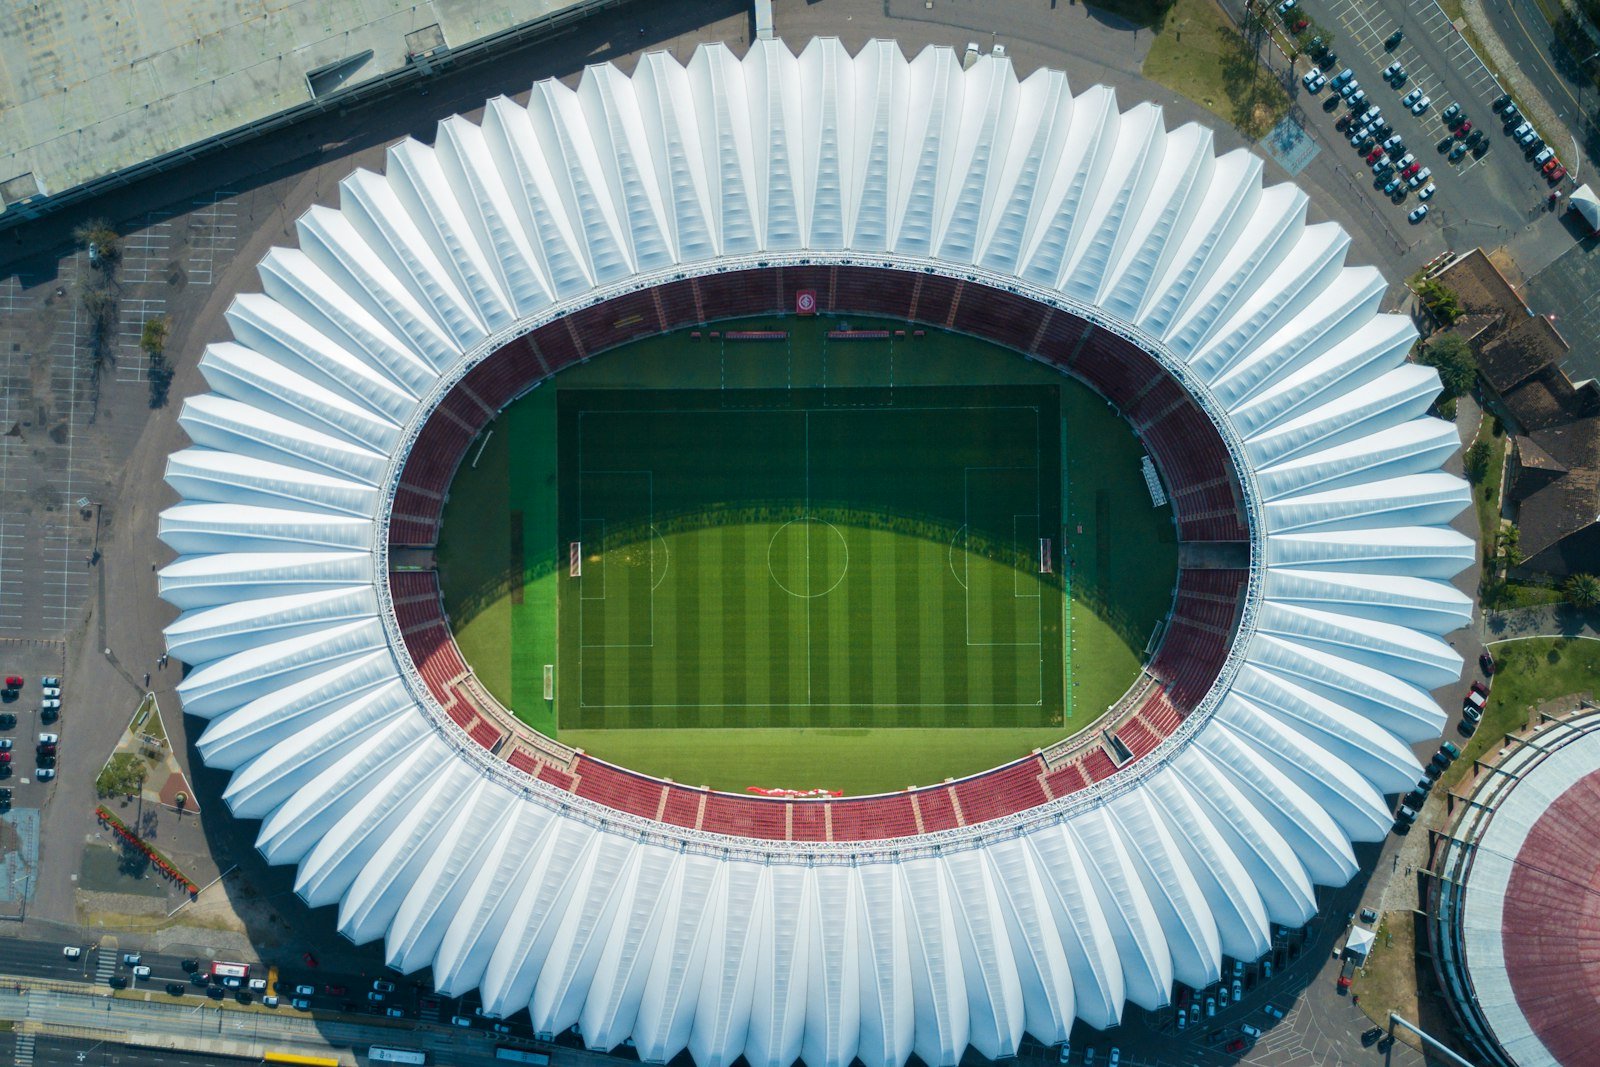
Venues that are ready on event day, and quiet when empty.
A venue runs a few dozen event days and hundreds of dark ones. Aqueduct baselines each day type separately, so a dark day leak or a match day peak stands out instead of averaging away.
What stadiums and venues teams are up against.
Water, energy, air and operations carry equal weight. Each one runs the same loop: monitor, measure, identify, act, verify.
Water: Concourse washrooms and irrigation
Leaks hidden under match day volumes
Energy: Bowl lighting, kitchens and cooling
Plant started hours early, left on after the crowd leaves
Air: Hospitality suites and concourses
Packed suites ventilated for an empty room
Operations: Dark days
Base load nobody checks between fixtures
Problem, solution, impact.
How Aqueduct resolves each problem for stadiums and venues, and what changes when it does.
Leaks hidden under match day volumes
A live water balance across meters and sub-meters localizes the loss, routes the fix and confirms it closed at the meter.
Loss found from the balance, not the bill, and every fix verified.
Plant started hours early, left on after the crowd leaves
Weather-normalized baselines per building and asset show the waste in money; schedules and setpoints adjust where control is enabled.
Savings stated in money and confirmed at the meter, not estimated.
Packed suites ventilated for an empty room
Air quality per zone, overlaid with occupancy, with ventilation raised when it matters and verified back in range.
Targets held during occupied hours, with the energy cost counted.
Base load nobody checks between fixtures
Faults diagnosed in plain language and routed into your CMMS with the fix; early signs of failure schedule maintenance first.
Fewer reactive call-outs and closures confirmed by the equipment.
One incident, from first signal to verified fix.
An illustrative example of the flywheel on a typical site.
Event calendar loaded alongside meters and BMS points.
A baseline per day type: event, dark, turf.
Dark day flow in the north stand above baseline.
Ticket to the venue engineer with the location.
Flow back to baseline before the next fixture.
Four connected products on one data layer.
Replace what should be replaced. Connect the rest.
- BMS and BAS
- EMS
- Leak and balance tools
- CMMS
- Event scheduling systems as an input
Three equal ways in: keep your BMS, replace it, or build Aqueduct in at design stage.
The questions each seat asks first.
“Will the plant be ready for the event?”
“Can we report per event?”
“What do dark days cost us?”
Standards and regulations we supply evidence for.
We supply the measured inputs. You run the program and file the report.
What leading venues already measure.
rainwater cistern at Mercedes-Benz Stadium, used for exterior irrigation.
Source: Mercedes-Benz Stadiuma year from 4,000 solar panels at the same stadium.
Source: Mercedes-Benz Stadiumroof rainwater cistern that makes the NHL ice at Climate Pledge Arena.
Source: Climate Pledge ArenaVenues are buildings under the same rules.
Worst EU buildings renovated first
The recast EPBD sets minimum performance for non-residential buildings, and venues are not exempt.
Life cycle carbon on certificates
New EU buildings over 1,000 square meters must disclose life cycle global warming potential.
Sources3 references cited on this page
Proven in live sites across sectors.
Anonymized results from live sites.
sites in 21 countries run on Aqueduct.
and 9 clinics in one of India’s top hospital chains.
US airport running water intelligence on Aqueduct.
of commercial real estate under Aqueduct.
Features that matter here
Common questions
Because event days and dark days use utilities so differently that one yearly average hides both. Judging a quiet Tuesday against other quiet days exposes a running urinal or passing valve within days, and judging each event against similar events shows which one ran over. See weather-normalized baselining.
Yes. Aqueduct attributes energy and water to each event window from the venue calendar, including load-in and load-out hours, so sustainability reports and event costing use measured figures. Promoters and finance teams see what each concert or match actually drew.
Start with what runs while the bowl is empty: air handlers, lighting, kitchens and concourse plant. Aqueduct compares dark day load with its own baseline and lists equipment running outside schedule, priced at the tariff. With owner approval, schedules can be enforced through LoRaWAN relays or BACnet field devices.
Yes. Aqueduct shows live venue load against your contracted or target peak and which loads are stacking, such as chillers, kitchens and lighting starting together before doors open. It recommends a start sequence so the event does not set a new demand peak. See peak demand management.
See Aqueduct on your own facility.
Bring a site, a utility bill or a question. We will show you where the loss is.