Best EHS monitoring software for dairy and food processing
 Milvian AI teamFacilities and infrastructure intelligence
Food plants need continuous records of effluent, water use, cold room and process area conditions. The monitoring layer measures; your EHS and food safety systems keep owning the programs.
What EHS looks like in a food plant
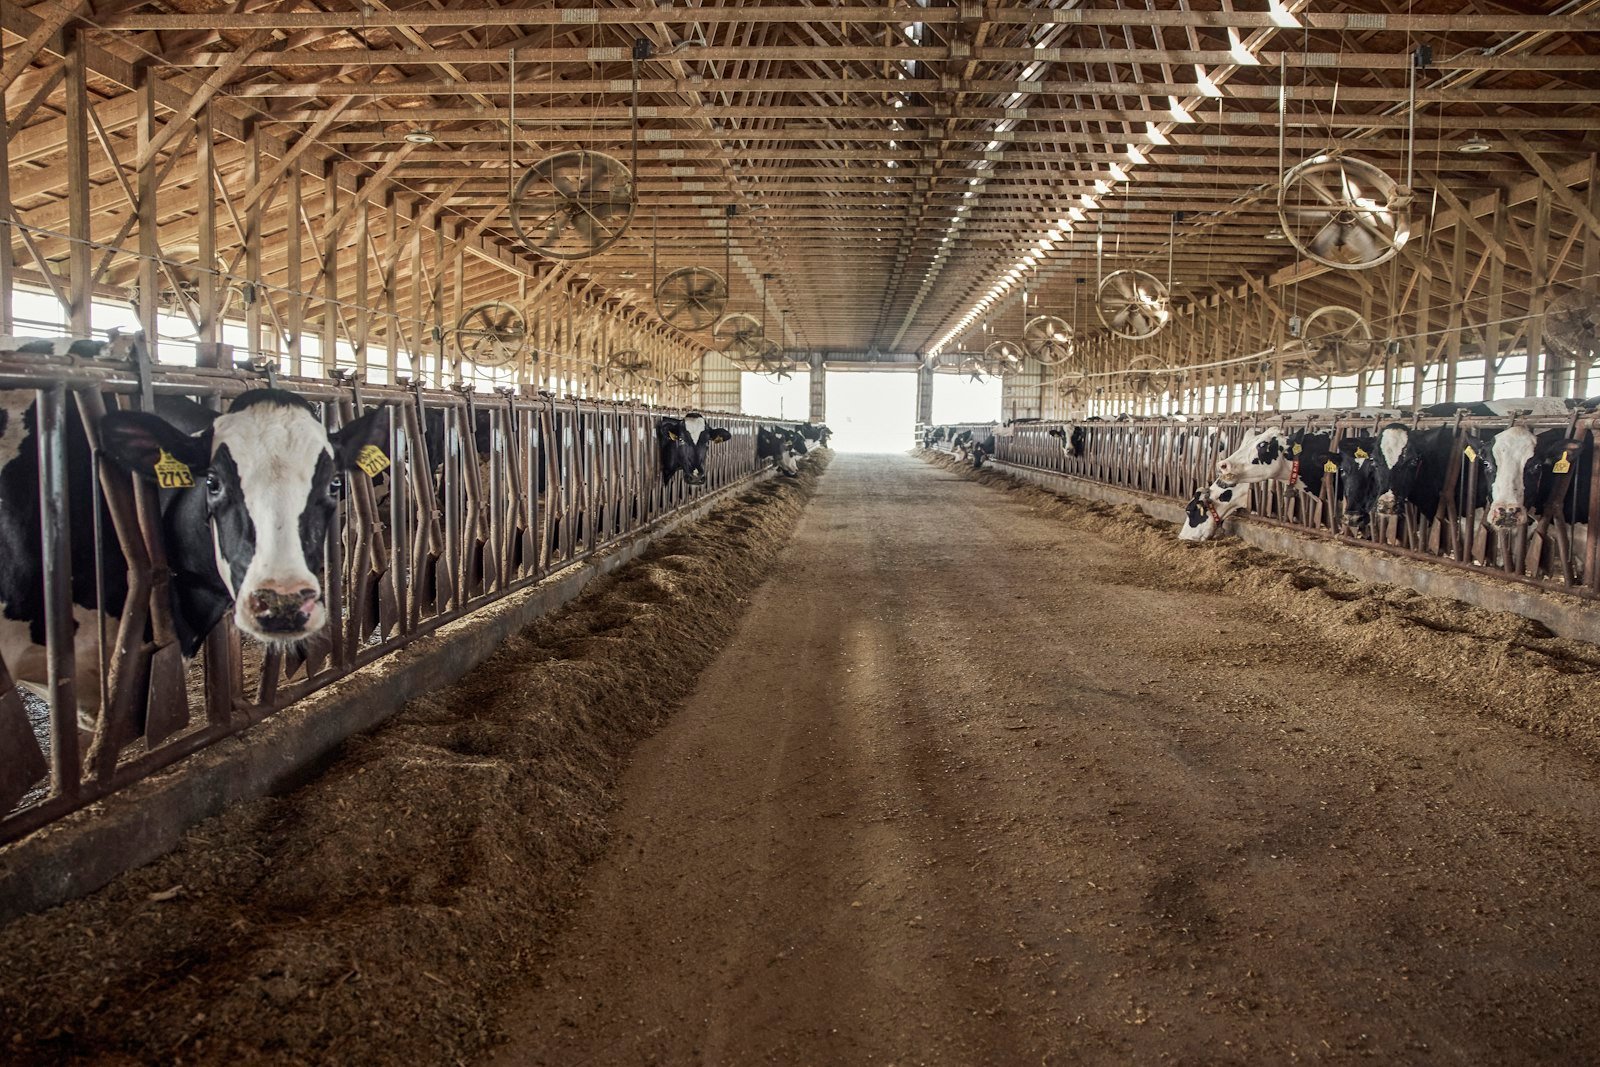
A dairy or food plant mixes environmental, safety and quality risk in the same rooms. Wash-down and CIP send large volumes to the effluent plant, where discharge consents set limits. Refrigeration areas carry their own hazards, and cold rooms must hold temperature for both product and people.
Air in process areas matters to workers. EPA notes some indoor pollutants run two to five times higher than outdoors, and cleaning chemicals raise VOCs in exactly the periods when sanitation crews are working.
What the monitoring must cover
| Requirement | Why it matters here | Ask the vendor |
|---|---|---|
| Effluent flow and treatment. | Discharge consents need records between samples. | Can you meter inlet, treated and discharged flow? |
| Wash-down water. | Water per liter or per tonne is a common target. | Can you normalize water by production? |
| Air in process and sanitation areas. | Cleaning shifts drive VOC peaks. | Do you show exposure by zone and time? |
| Cold room conditions. | Temperature drift affects people and product. | How do you alert on drift and record it? |
Standards and direction
ISO 14001 requires monitoring of significant environmental aspects, and ISO 45001 covers occupational health and safety. Large processors in Europe report water consumption, withdrawal and discharge under ESRS E3. Water stress raises the stakes: WRI projects 31 percent of global GDP will be exposed to high water stress by 2050.
How to evaluate it
- Start at the effluent plantMeter inlet, treated and discharged flow.
- Add sanitation-area airMeasure VOCs and CO2 during cleaning shifts.
- Link production volumeReport water per unit from the first month.
- Route one eventSend a drift alert into your EHS workflow.
Where Aqueduct fits
aQ WaterGuard meters wash-down, CIP and effluent lines and shows STP efficiency on a live twin. aQ AirSafe measures VOCs, CO2, temperature and humidity by zone and counts exposure in zone-hours, so a nightly cleaning spike shows as a pattern. Food safety and EHS programs stay with your teams; Aqueduct keeps the readings and sensor health.
Sources
| Source | Link |
|---|---|
| US EPA, Indoor Air Quality | epa.gov |
| EFRAG, ESRS E3 delegated act | knowledgehub.efrag.org |
| World Resources Institute, Aqueduct 4.0, 2023 | wri.org |