

A top 25 US airport live on Aqueduct in two weeks.
A top 25 US airport connected 5,000 meter points across 2M+ sq ft of aging, mixed infrastructure to Aqueduct without rip and replace. It went live in two weeks and surfaced a major leak right away.
For an operations leader, the case is one line: value arrived in two weeks from equipment the airport already had.
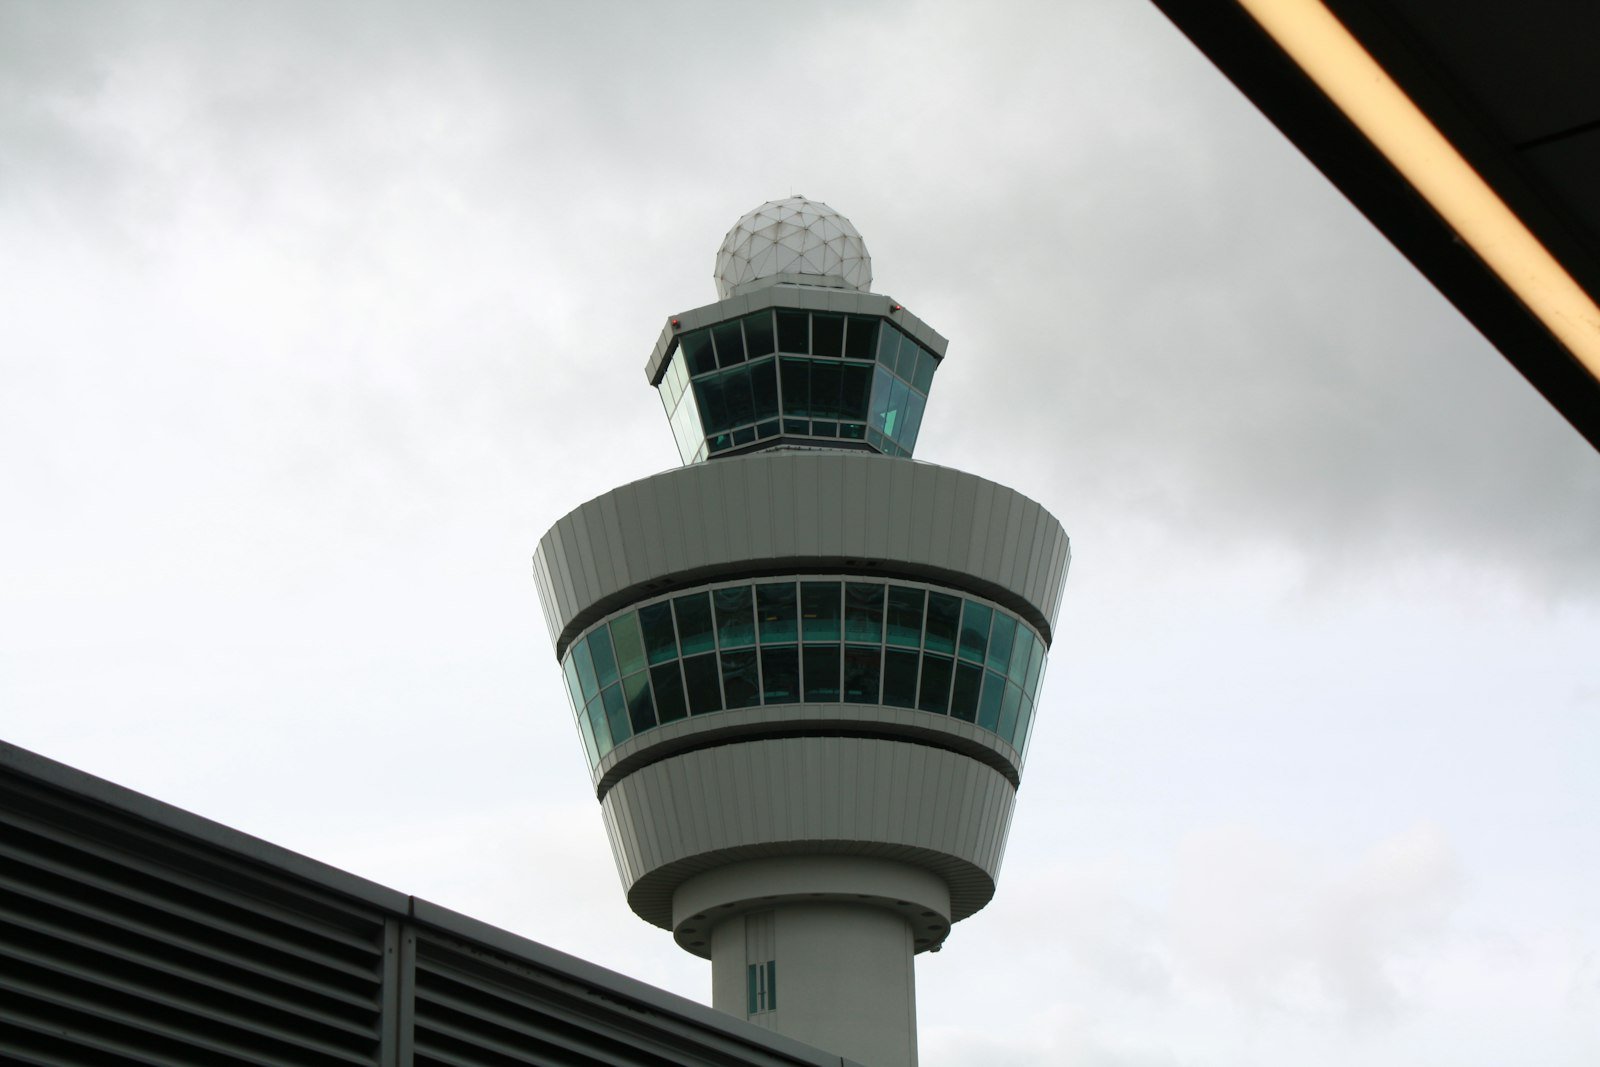
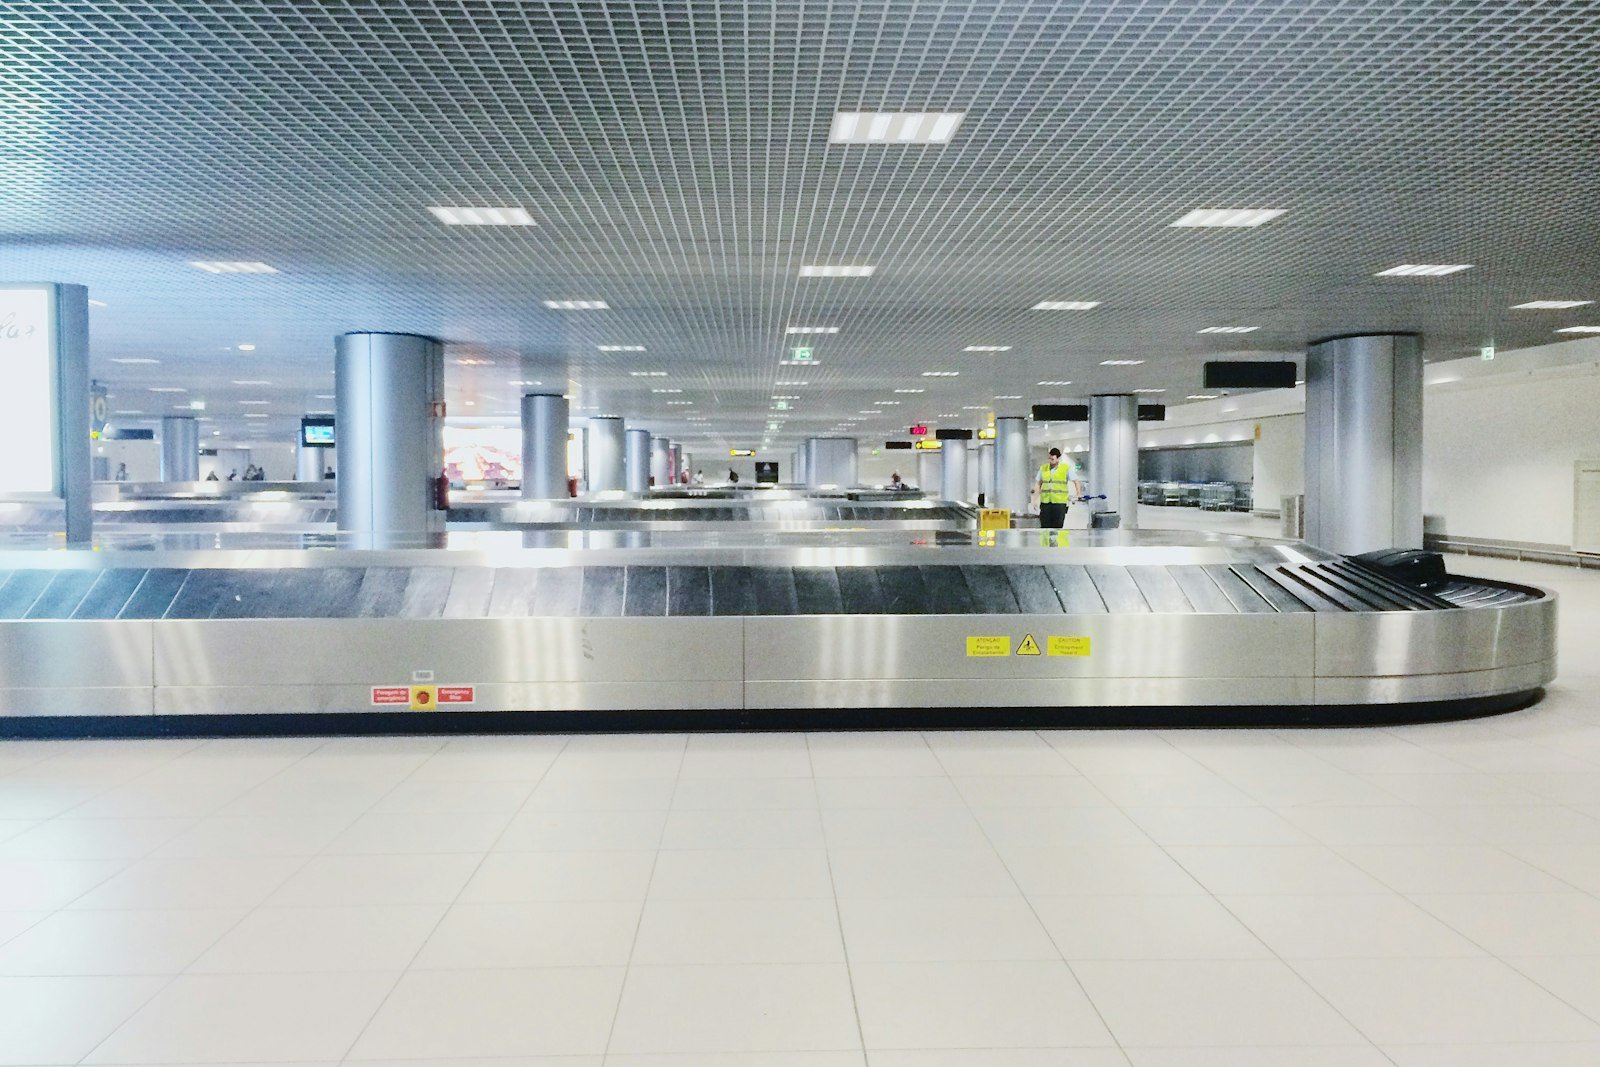
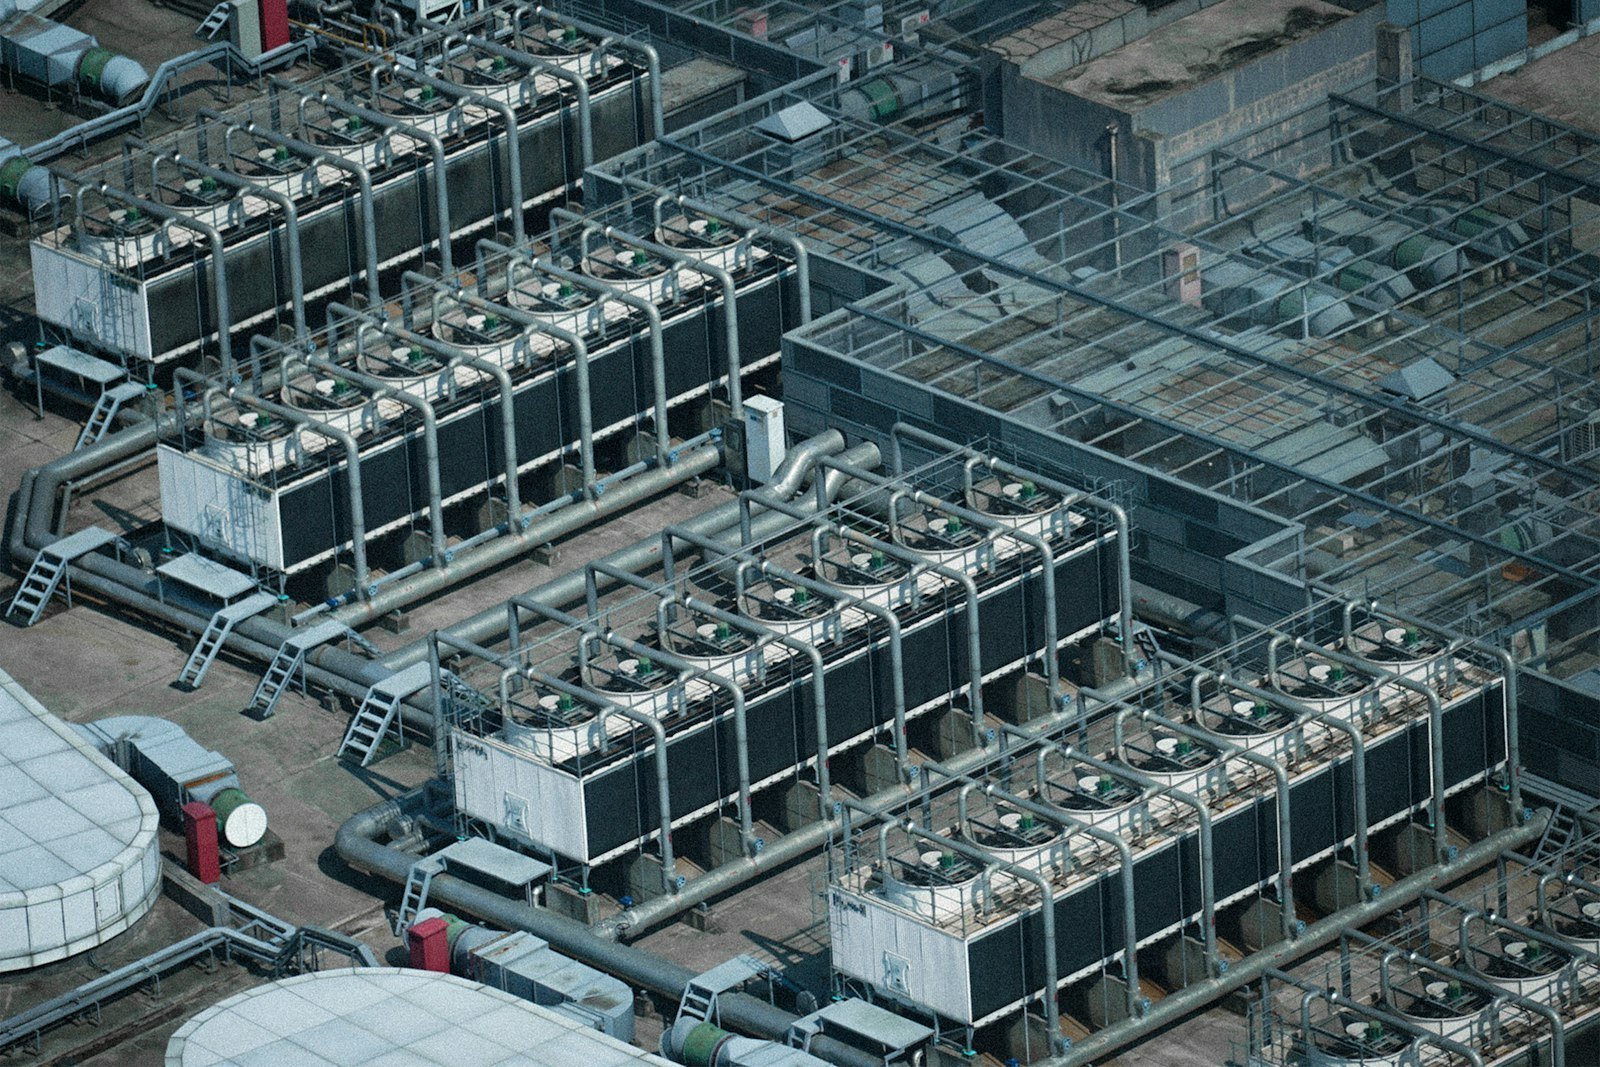
Water spread across a campus that never closes
Water serves terminals, concourses, restrooms, food service and plant rooms. Much of the infrastructure was twenty years old and came from different vendors, and meters were read by hand, so a leak could run for months before it showed in the numbers.
A campus that operates 24/7 could not stop for new infrastructure.
A live water balance over the systems already in place
Aqueduct read the existing meters as they were and mapped each point to its terminal, floor and zone in aQ Core.
aQ WaterGuard reconciles supply against use and learns normal flow for each area. Anything outside that pattern goes straight to the facility team that owns the area.
- 01
Map the campus
Terminals, floors and zones are set up so every point belongs to a place.
- 02
Connect what exists
Legacy meters are read over the protocols they already speak, such as Modbus, BACnet, M-Bus, pulse and LoRaWAN.
- 03
Balance and baseline
The water balance closes, and normal flow is learned area by area.
- 04
Detect and route
Anomalies reach the owning team at any hour, with the location attached.
| Layer | What we deployed |
|---|---|
| Hierarchy | Campus, terminals, floors and zones in aQ Core. |
| Metering | Existing points read as they are, with device health scored. |
| Water | aQ WaterGuard balance and flow baselines. |
| Response | Alerts routed by area to the facility team. |
A leak found at go live
The first finding arrived at go live: a major leak that manual reads would have missed for months, found from infrastructure the airport already owned and with no downtime for the terminals. A silent or faulty meter now shows up as a data problem rather than a false all clear.
The same aQ Core layer can carry energy and indoor air next: aQ EnergySmart for the central plant, aQ AirSafe for the terminals, and Smart Controls where control is enabled, with owner approval.
 Fulfillment operations and corporate real estate
Water stewardship across Amazon's fulfillment network, built with Amazon.
 Healthcare
Utility and critical room intelligence for one of India's top hospital chains.
 Commercial real estate
Recharge, chiller plant and water intelligence for a 20M+ sq ft developer.
Common questions
No. Existing meters of mixed age and make were connected in their native protocols, and nothing had to be removed or rewired. That kept terminals running throughout and is the main reason the go-live took two weeks. See pulse counters.
The facility team that owns the terminal, floor or zone where the flow changed. Every meter point is mapped to a place in aQ Core, so an alert at 3 AM arrives with its location and the right owner. See aQ Core.
By comparison with each area's expected flow. Once the balance closed, one area showed sustained flow far above its normal, which crews traced to a major leak on the first day live. Device health scoring keeps a faulty meter from posing as a leak. See leak detection.
It applies wherever a large campus has mixed, aging meters that already report. The path is the same: map the hierarchy, read what exists, close the balance, then route anomalies by area. The two week timeline depended on existing meters being readable. See airports.
See Aqueduct on your own facility.
Bring a site, a utility bill or a question. We will show you where the loss is.