
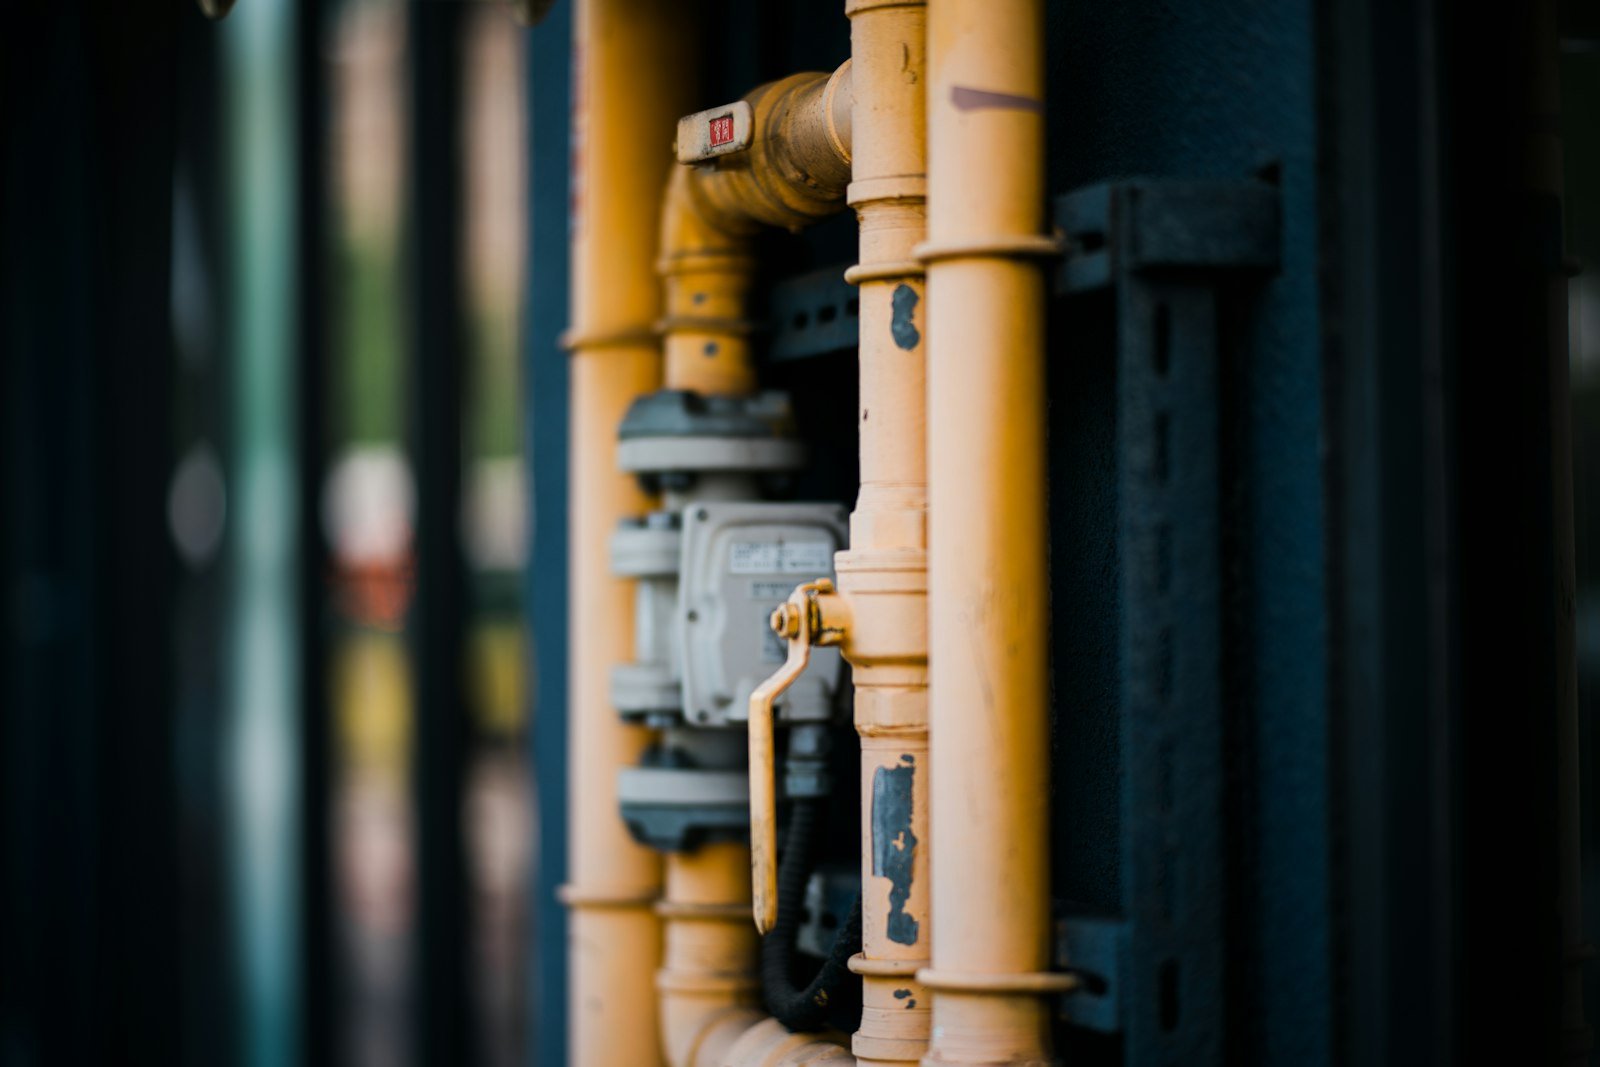
Water stewardship across Amazon's fulfillment network, built with Amazon.
Milvian and Amazon's fulfillment organizations built this water monitoring platform together. Its site, asset and device model became the foundation of aQ Core.
The program began as a joint build rather than a standard deployment, and it is still expanding.
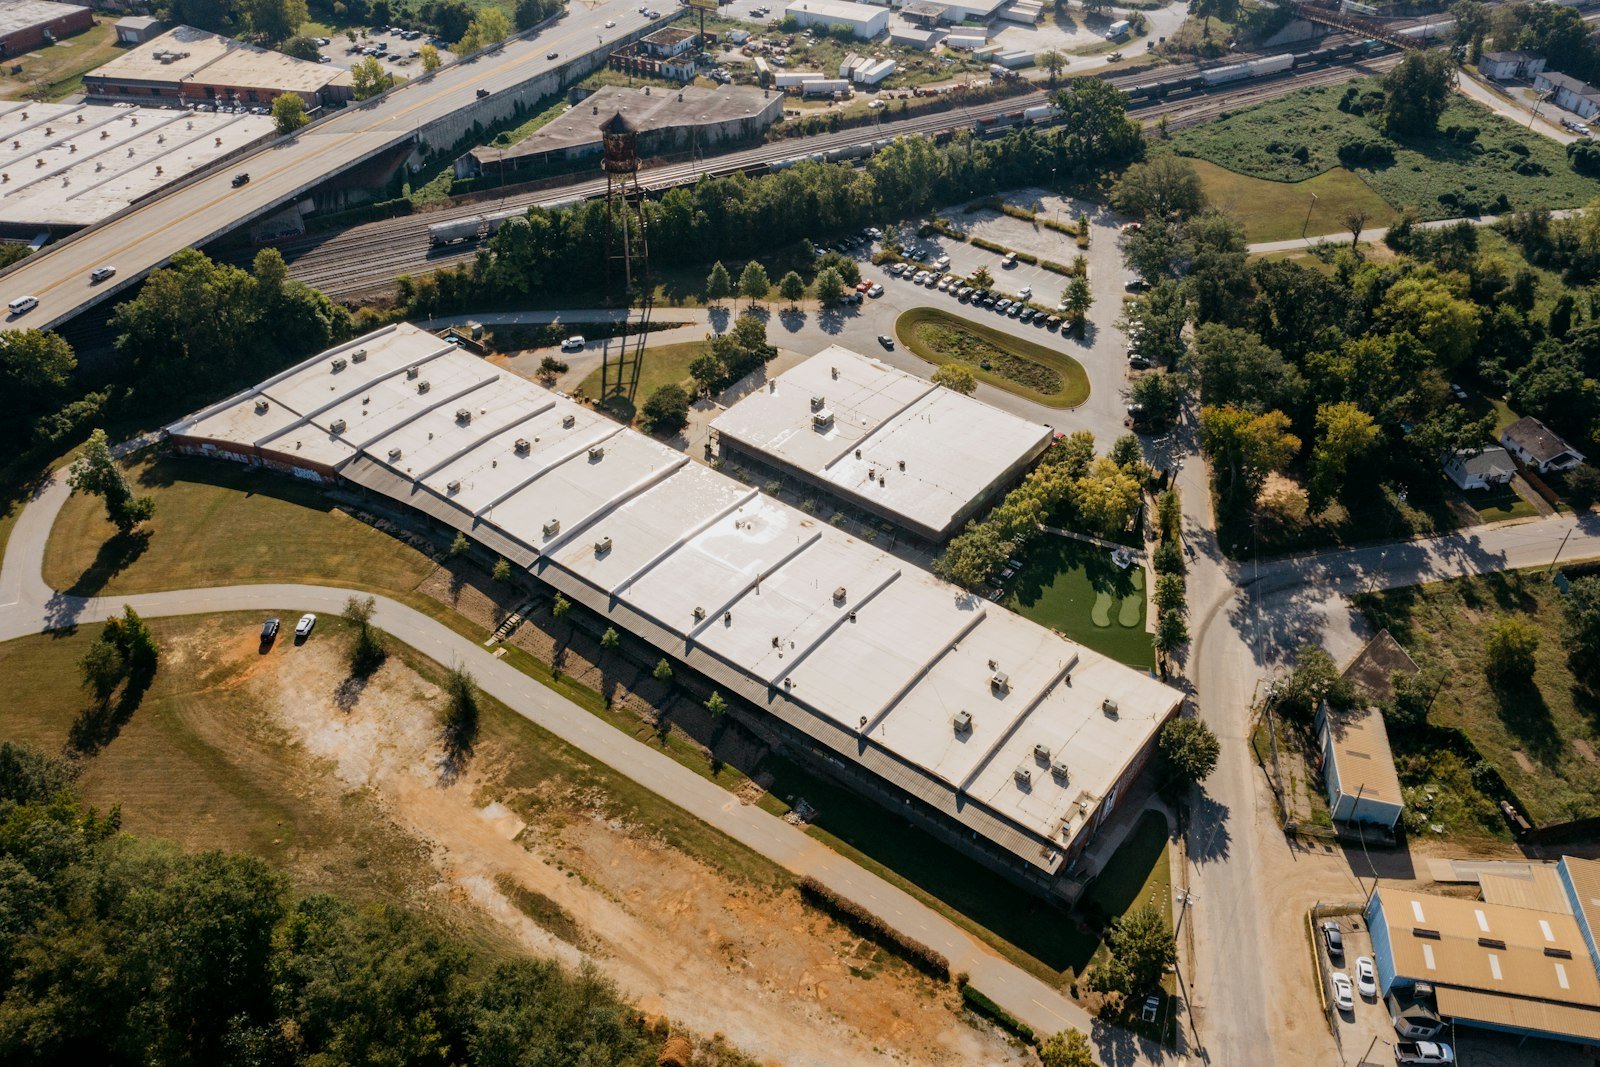
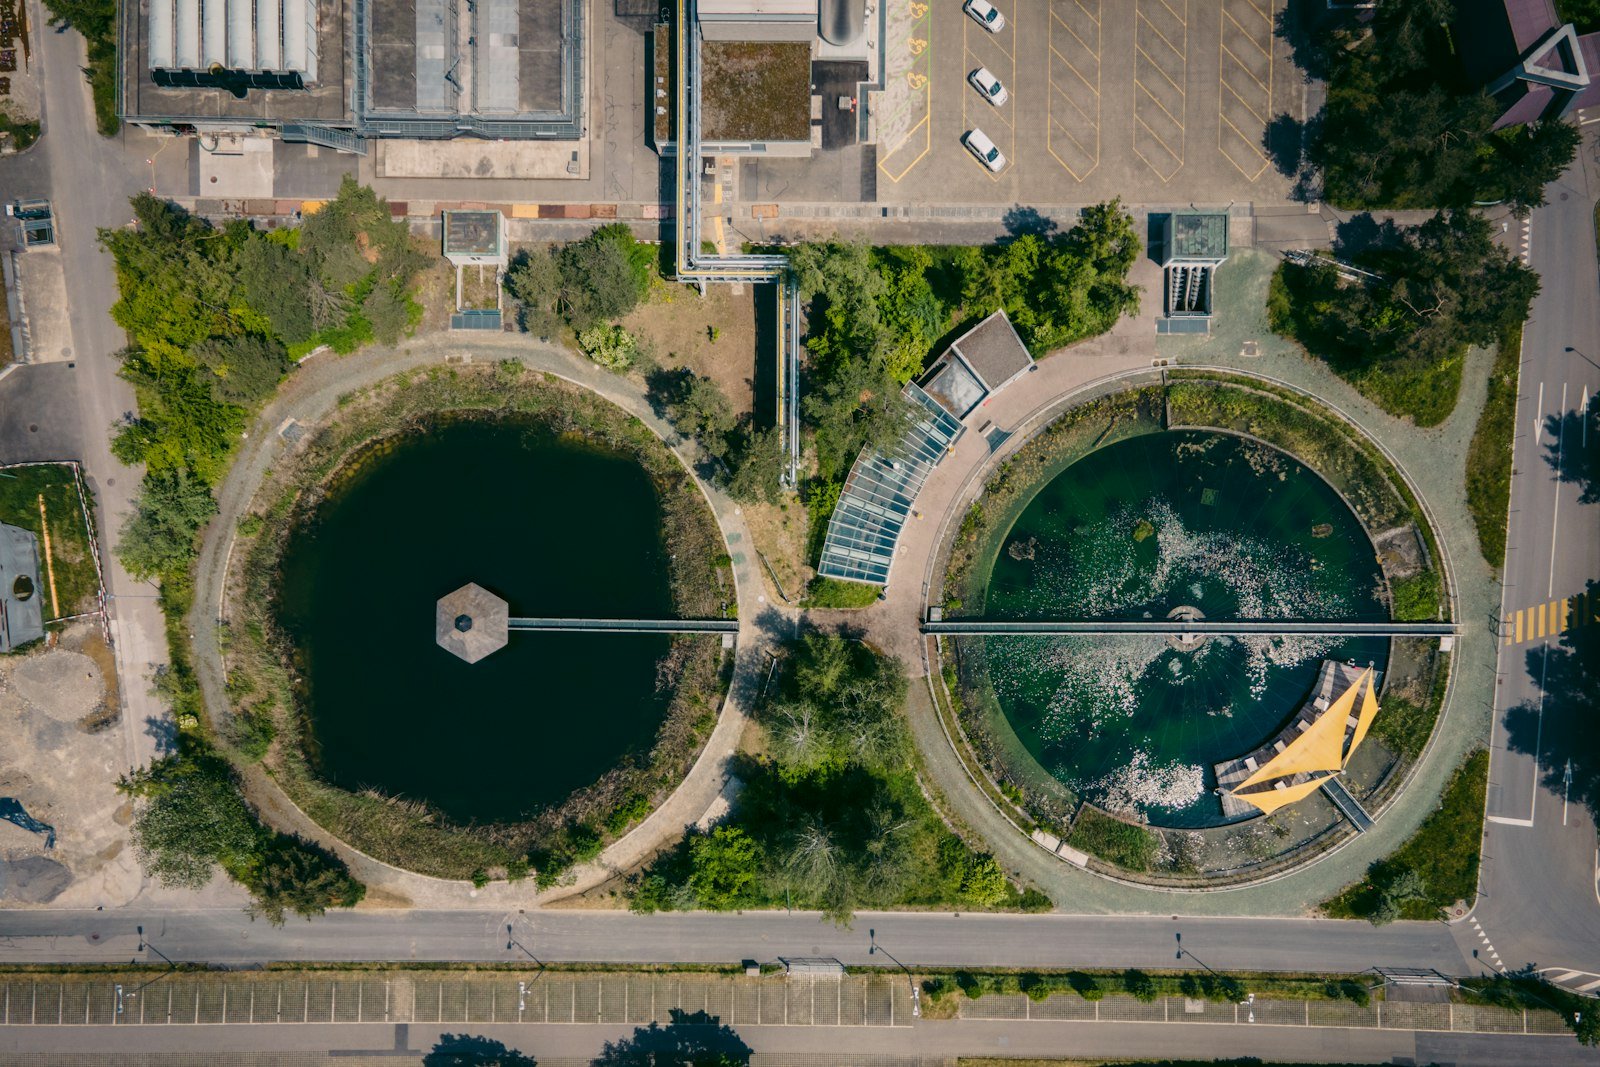
A varied network that a monthly bill could not explain
A warehouse, a distribution center and a fulfillment center each use water in their own way, and use shifts through the year. A monthly bill per site gave a total, not where the water went or when a pattern changed, so leaks tended to surface only when the bill arrived.
A water monitoring platform, built together
Milvian brought metering, connectivity and installation. Amazon brought the requirements and operating conditions of its sites.
Lessons from the build, including how to organize sites, assets and devices and how to score data quality, went into aQ Core.
- 01
Survey and instrument
Each site is surveyed, then metering and connectivity are selected, installed and validated as a service.
- 02
Score the data
Readings are scored for quality as they arrive, so a silent meter is visible.
- 03
Learn normal
Expected water use is learned per site type and per season.
- 04
Flag the break
Flow that departs from that expected pattern is flagged as it happens for the site team to investigate.
| Layer | What is deployed |
|---|---|
| Field | Water metering and connectivity at each site. |
| Teams | aQ Atria for site and portfolio users. |
What the program delivers
Operations and GREF teams see every site in one portfolio view and can drill into a single site to see what changed and when. Sustainability teams get a metered record of site water use, which is stronger evidence than a bill.
Milvian is helping GREF build an updated version of the platform to GREF's specifications, and aQ Core now serves other multi-site portfolios.
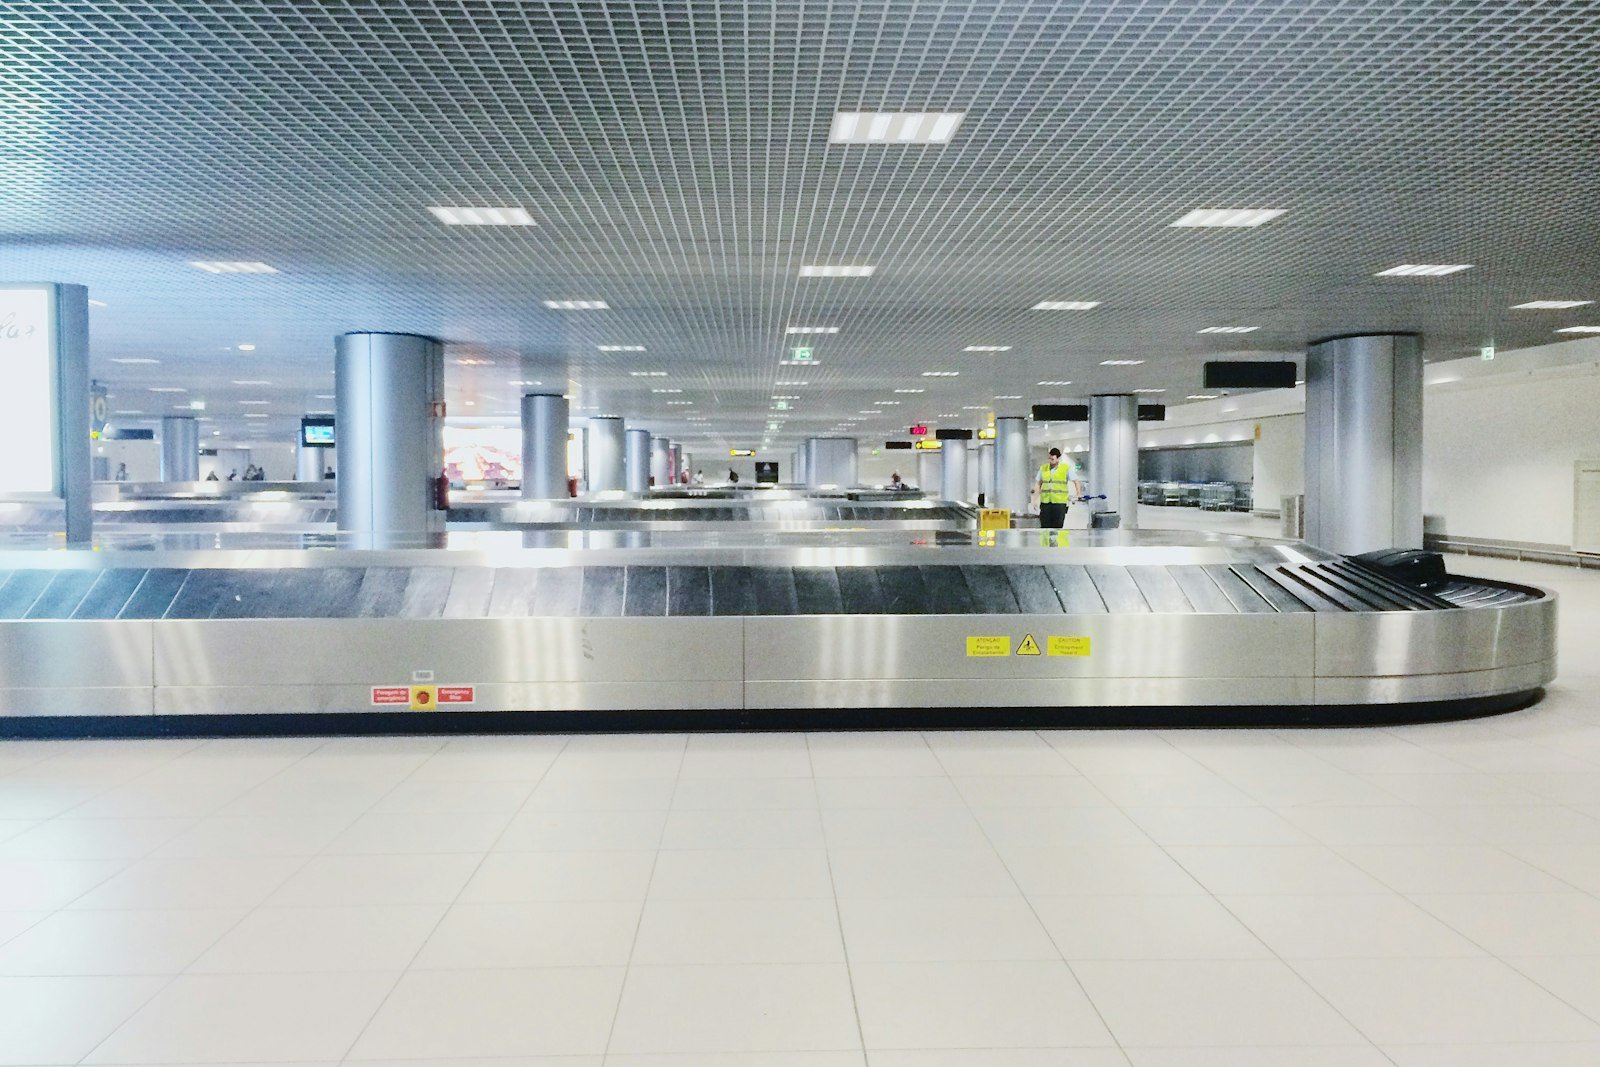 Aviation
A top 25 US airport live on Aqueduct in two weeks.
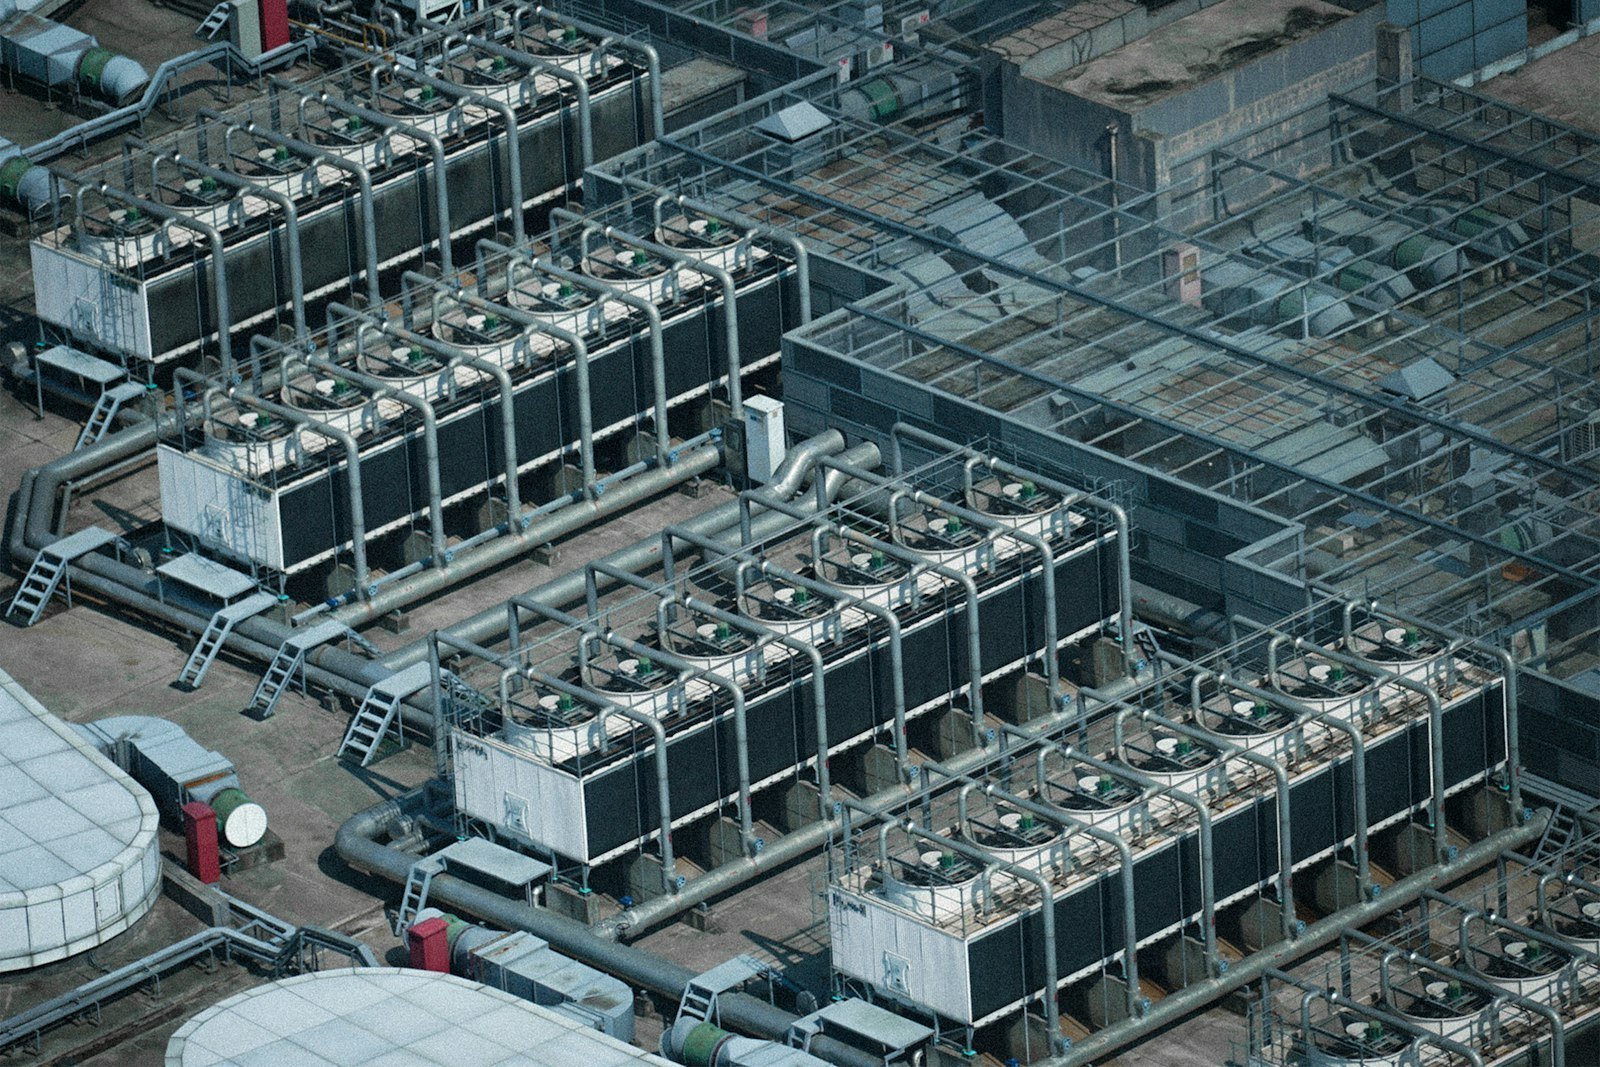 Healthcare
Utility and critical room intelligence for one of India's top hospital chains.
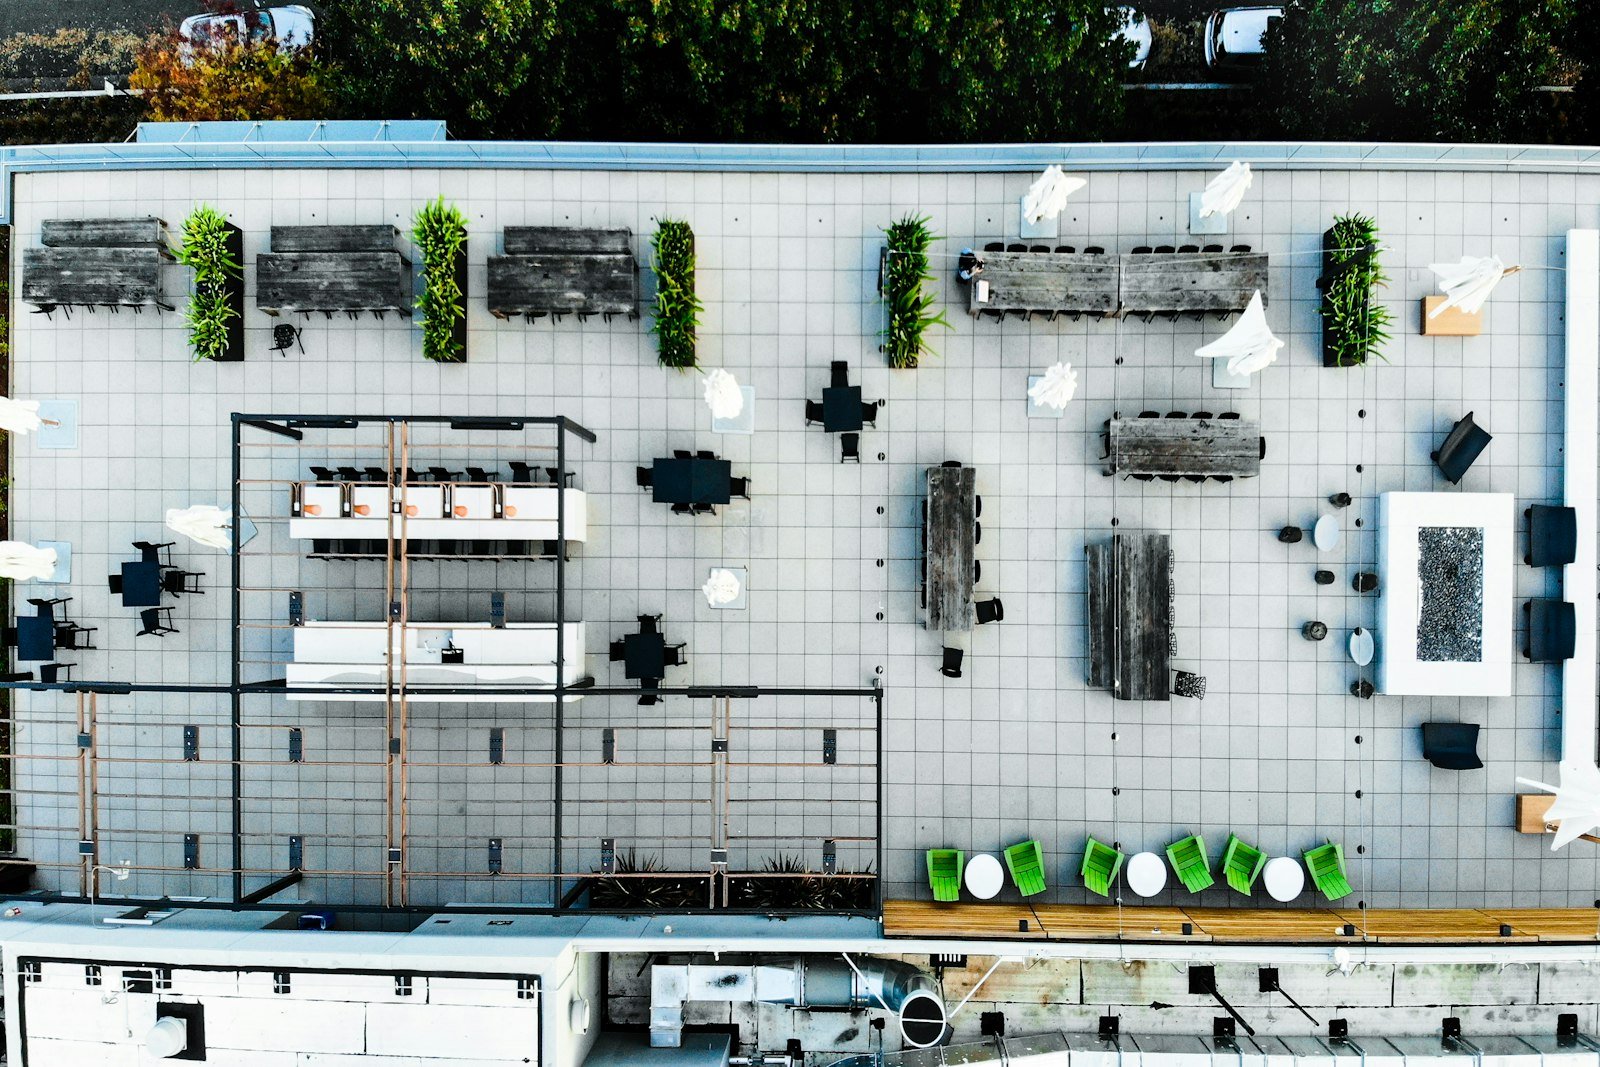 Commercial real estate
Recharge, chiller plant and water intelligence for a 20M+ sq ft developer.
Common questions
Metered water use at each live site, from warehouses to corporate offices. Readings are compared through the day with what that kind of site normally draws in that season. Before the program, a monthly bill gave each site a single total and no timing. See aQ WaterGuard.
Because normal use differs: a distribution center in summer and a corporate office in winter look nothing alike. Each site is compared with its own kind and time of year. That keeps a seasonal rise from being flagged as a leak. See weather-normalized baselining.
Every incoming reading gets a quality score. A meter that stops reporting or sends implausible values is flagged as a device issue, so the team never mistakes missing data for zero use or a fixed leak. See asset observability.
Lessons from the Amazon build now shape how aQ Core organizes any large estate. A retailer or logistics network with many similar buildings gets the same portfolio view, per-site drill down and seasonal comparison by building type. See portfolio benchmarking.
See Aqueduct on your own facility.
Bring a site, a utility bill or a question. We will show you where the loss is.