
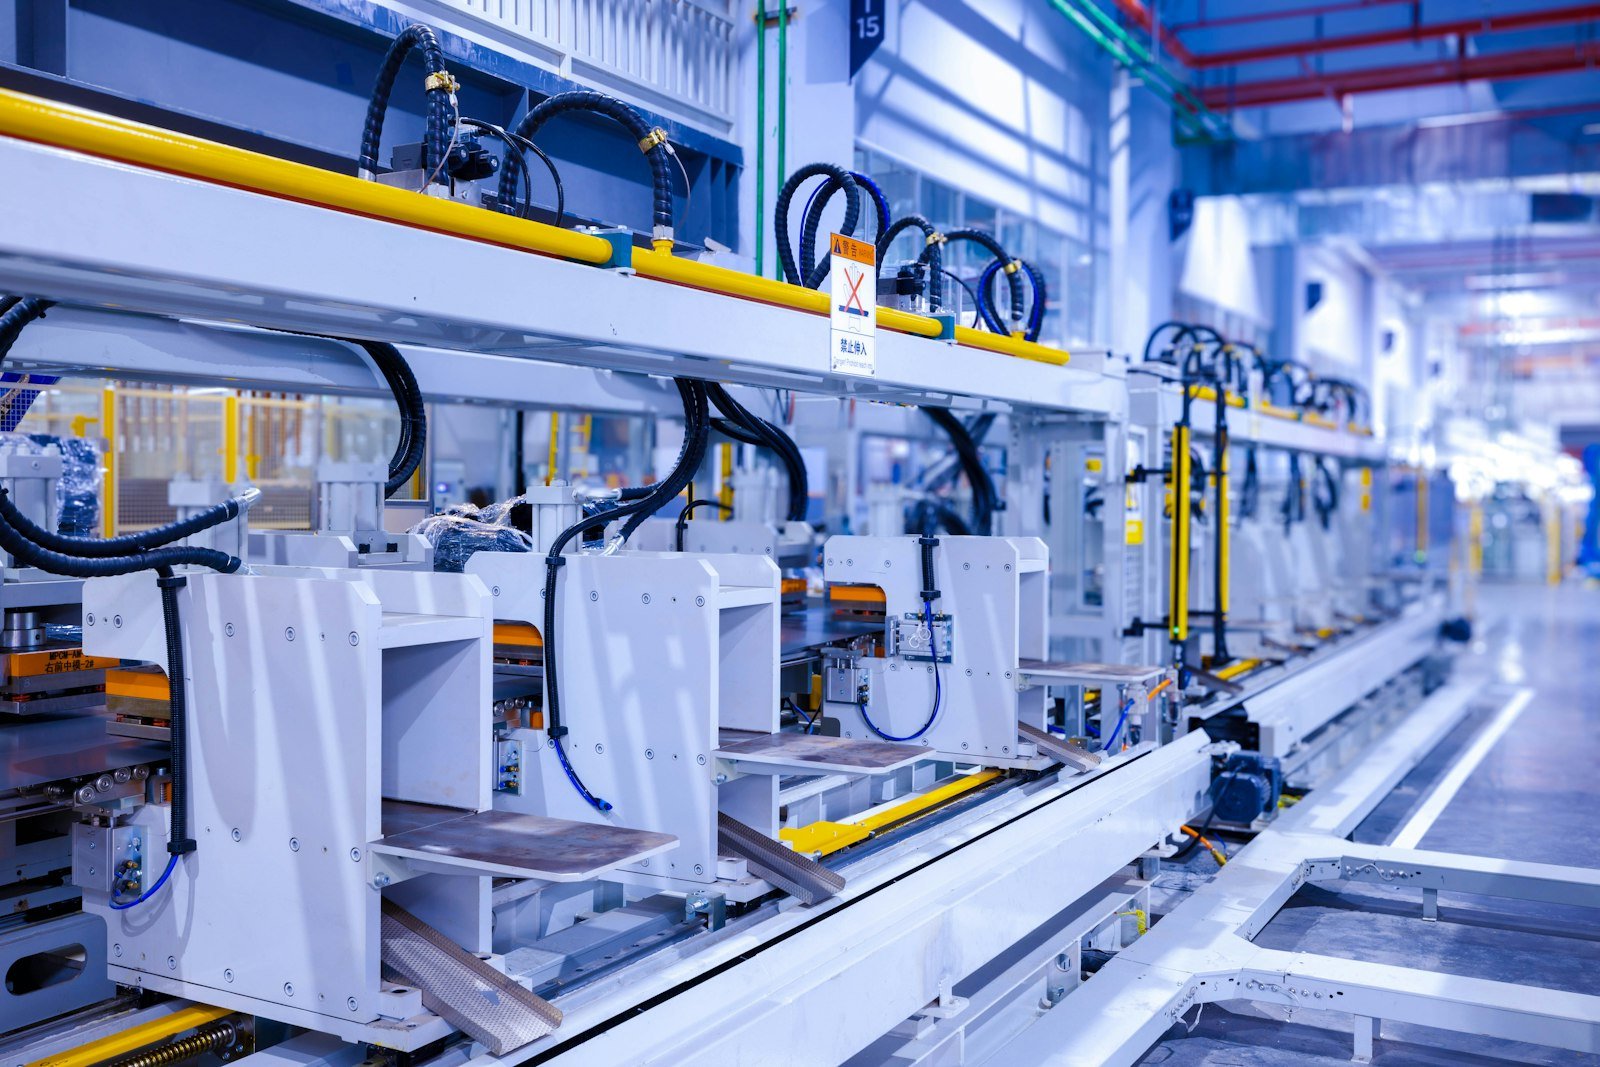
Water and energy intelligence for a 300-acre FMCG campus.
A 300-acre FMCG manufacturing campus with 8 business units is scoped onto Aqueduct, starting with one high intensity plant, proving it in a quarter, then scaling across the campus.
The method is to prove one contained plant in about a quarter before asking it to cover a whole campus.


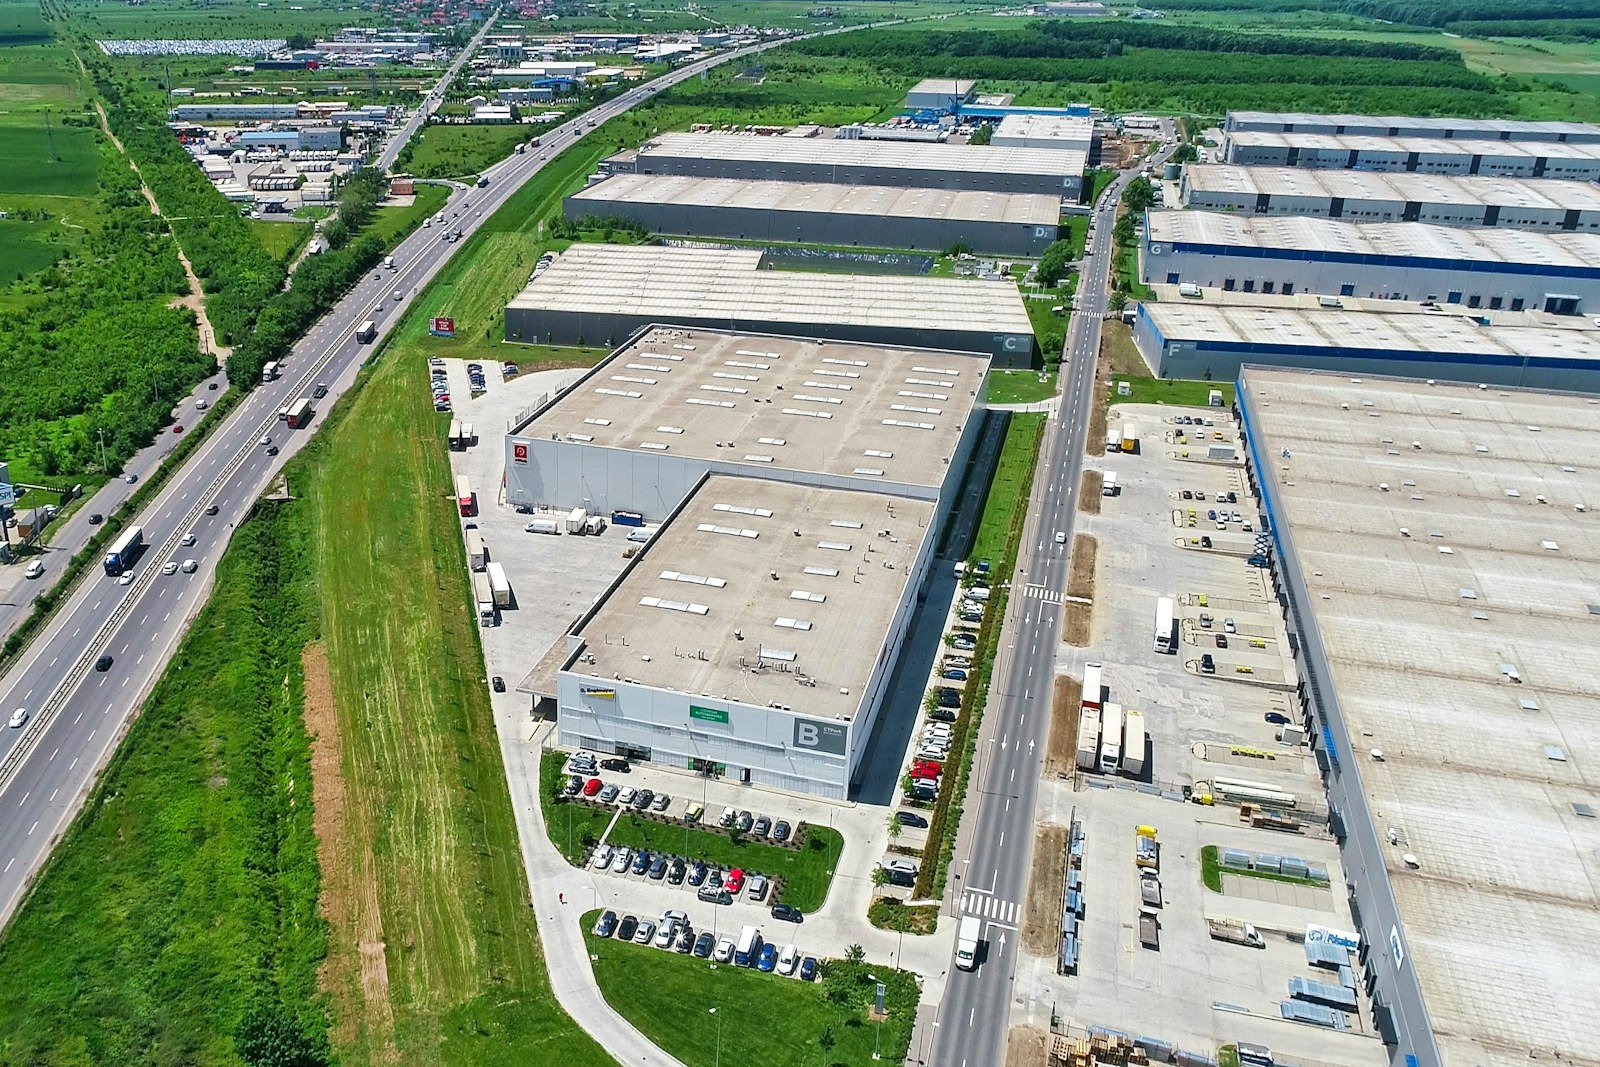
Many units, one campus nobody could see whole
The campus runs flour and atta mills with 200+ TPD of grain milling, dairy and ghee, beverages and juices, herbal and ayurveda, edible oils, 30+ spice lines, personal and home care, and packaging. Each unit meters its own bill, but no one could compare them.
The campus sits in a water stressed geography, and reuse from STP, RO reject, cooling blowdown and condensate is under instrumented. BRSR disclosure, pollution control board effluent norms and zero liquid discharge expectations call for line level, timestamped records.
One live campus on aQ Core, starting with one plant
aQ WaterGuard builds a live balance for the pilot plant, where supply equals use plus fire, RO feed and unaccounted loss. Tanks, headers, RO and STP update every 60 seconds, so the loss term rises before the bill does.
aQ EnergySmart tracks feeder load, power factor, peak demand, solar offset and distribution losses. Portfolio views rank units by intensity and use per unit of output, and Smart Controls can schedule pumps, VFDs and air handlers where control is enabled, with owner approval.
- 01
Survey
On day 0, the team walks the pilot unit, checks wireless coverage and pulls 12 months of water and power bills.
- 02
Plan
By week 2, the sensor list, gateway layout and balance model go to the campus team.
- 03
Meter
In weeks 3 to 8, non intrusive flow, pressure, level and power sensors are fitted without interrupting production.
- 04
Go live
By about day 90, the twin of the beverages and juices plant is live, with first losses named.
- 05
Scale
Dairy and ghee, edible oils and herbal units follow in quarters 2 and 3, and every unit joins one view in quarter 4.
| Layer | What the program plans |
|---|---|
| Pilot | Process water, CIP wash downs, rinsing, RO polishing, boilers and cooling. |
| Reuse | STP, RO reject and condensate measured, so recovery is verified. |
| Reporting | Withdrawal, consumption, discharge and reuse records for BRSR, GRI 303 and CDP Water. |
Expected outcomes
- Leaks, idle draw and power factor penalties found.
- Bursts, overflows and demand spikes caught in 60 seconds, not next month.
- Plants compared on intensity per tonne or per liter.
- Audit grade records for BRSR, PCB and ZLD disclosures.
Dairy and ghee is planned as pilot two, drawing on Milvian AI's dairy work.
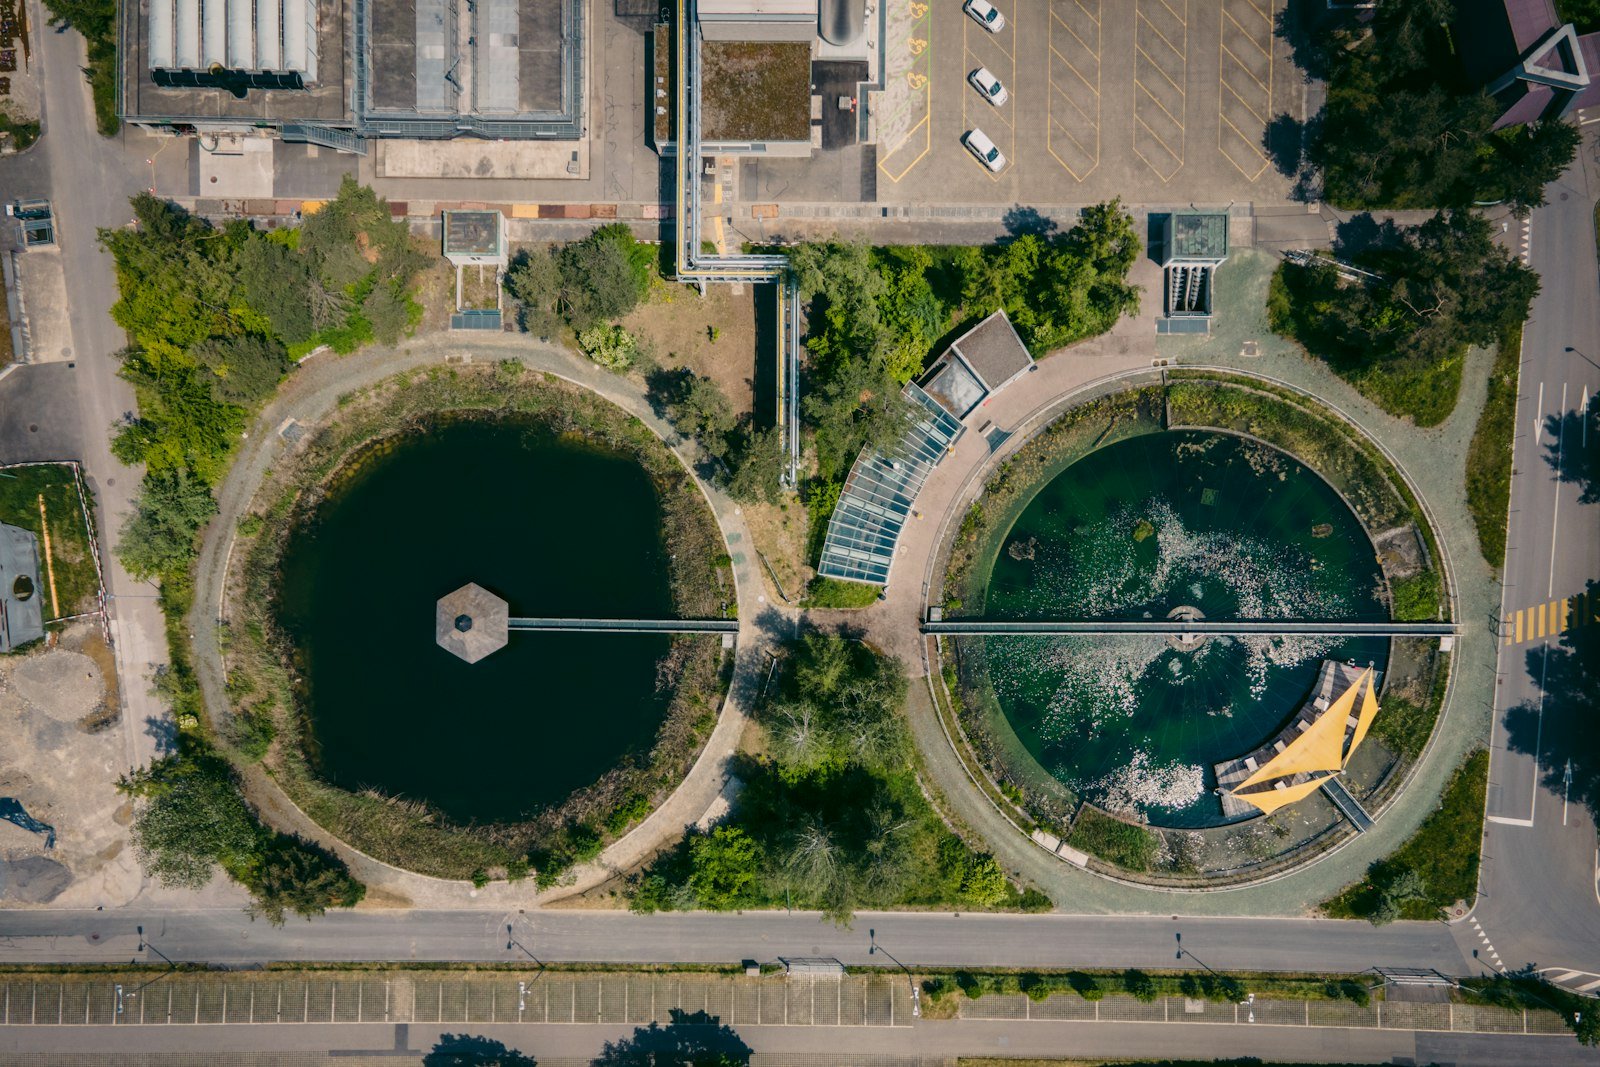 Fulfillment operations and corporate real estate
Water stewardship across Amazon's fulfillment network, built with Amazon.
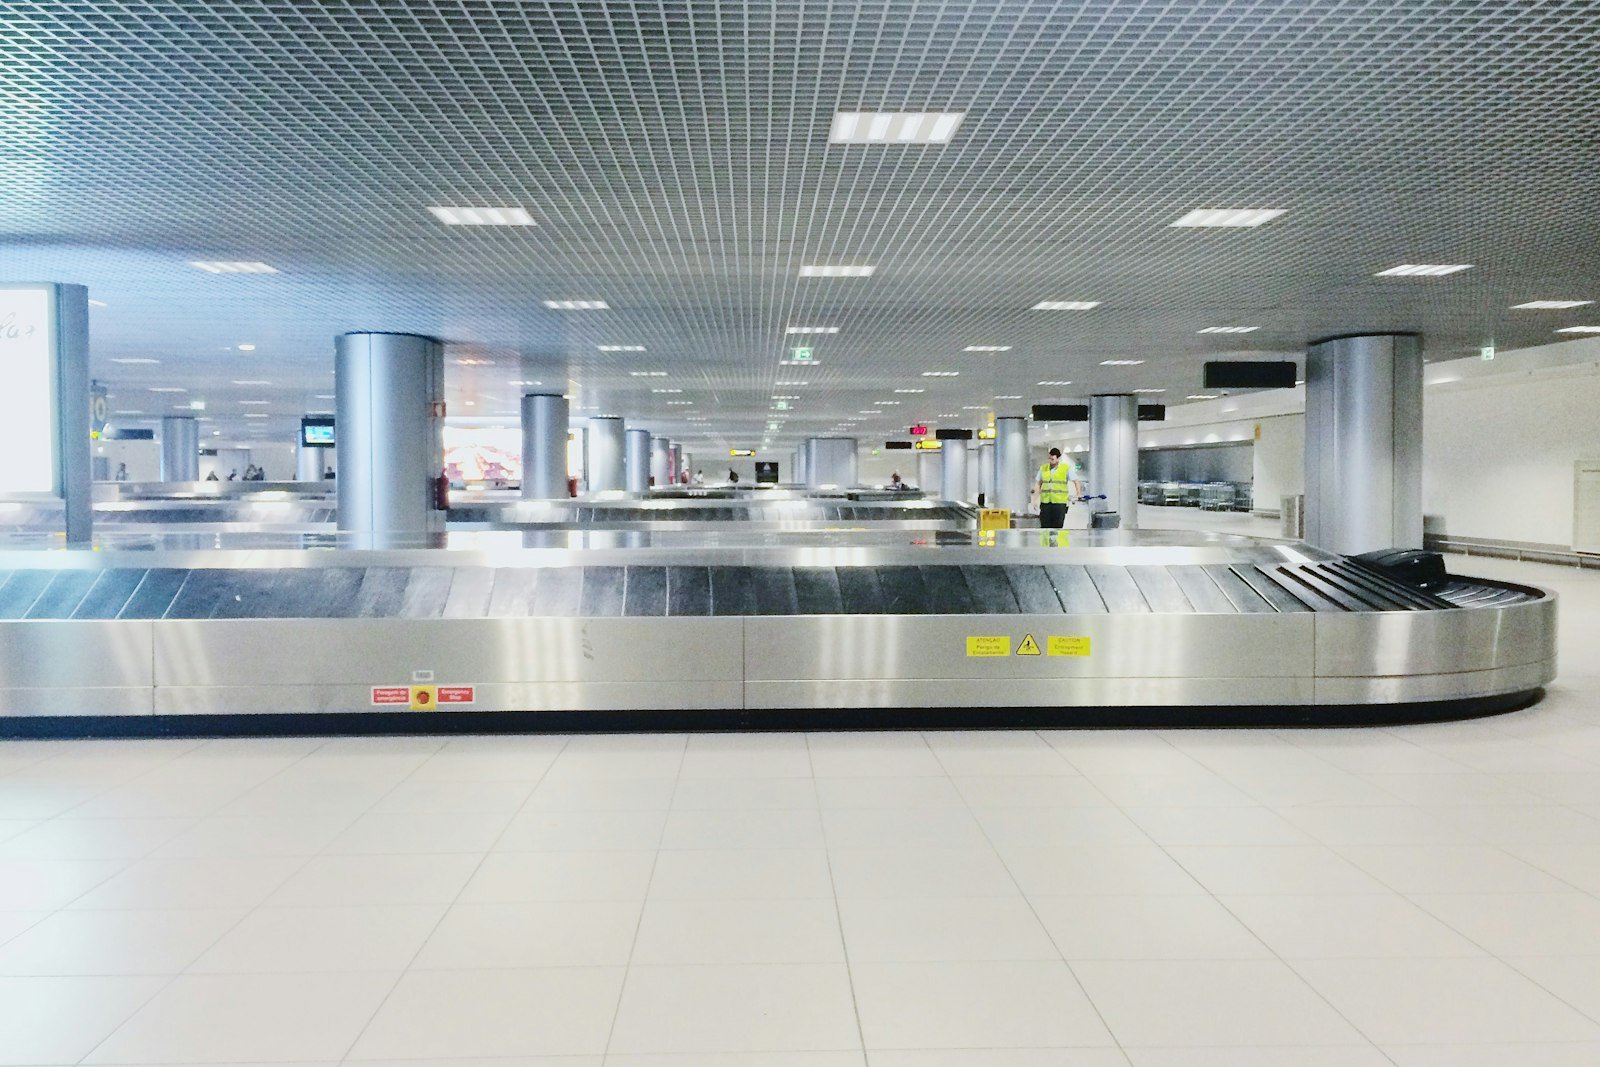 Aviation
A top 25 US airport live on Aqueduct in two weeks.
 Healthcare
Utility and critical room intelligence for one of India's top hospital chains.
Common questions
It has clear boundaries: one supply, one discharge and one energy feed to reconcile. A contained plant lets the water and energy balances close quickly before the method scales to the other units. See FMCG manufacturing.
No. The sensors clamp on or fit without cutting into process lines, and installation is phased around each unit's schedule, so production keeps running while the pilot plant is instrumented. See process water and utilities.
Every water and energy use in the pilot beverages plant, from wash downs to boiler feed. Treated and recycled streams are metered too, so recovery is measured rather than assumed. Business units are later ranked by resource use per unit of output. See water reuse, STP and RO.
Each water flow is stored with its time and line, so disclosures can be built from records instead of estimates. The same data serves BRSR, GRI 303 and CDP Water, and the effluent norms the state board enforces. See BRSR Core.
See Aqueduct on your own facility.
Bring a site, a utility bill or a question. We will show you where the loss is.