
STP and RO plant monitoring for measured water reuse
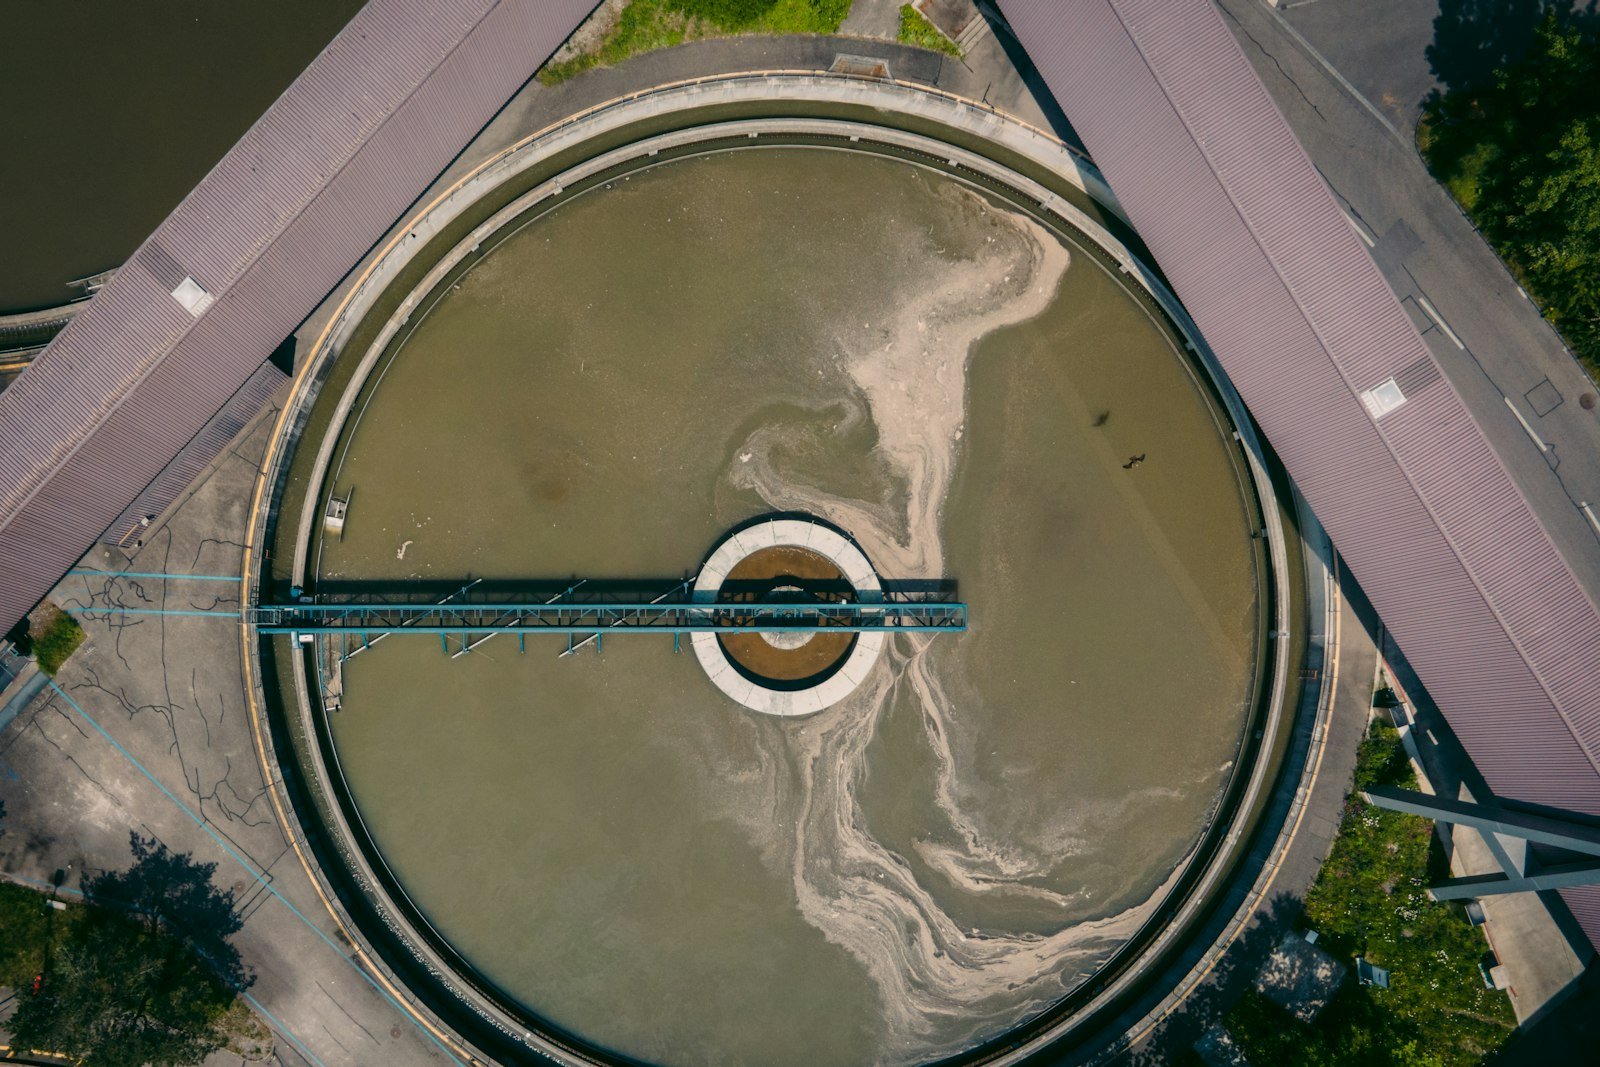
On-site sewage treatment and reverse osmosis plants are often run to a log sheet, so efficiency drifts and reuse is assumed rather than measured. Aqueduct tracks STP inlet, treated flow and efficiency, and RO feed, permeate, recovery and TDS, live on the water digital twin.
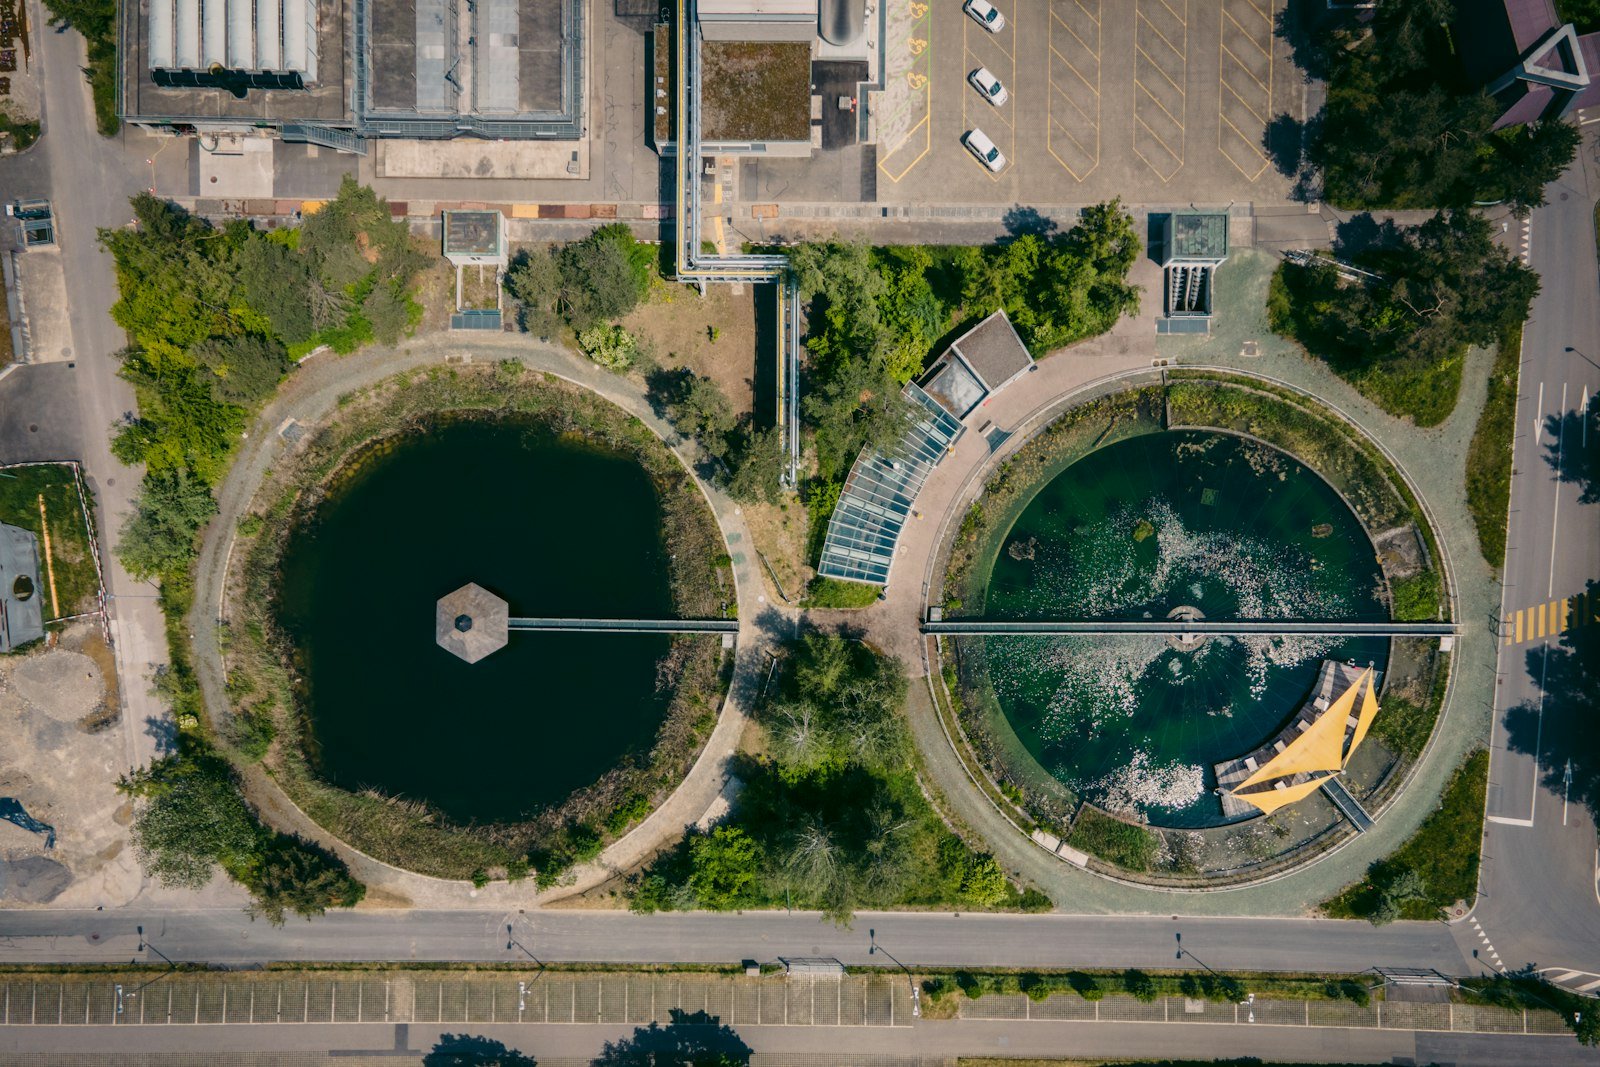
Reuse only counts if it is metered.
Why on-site treatment underperforms
- Manual logs
Readings are taken once a shift, so a falling recovery rate goes unnoticed for days.
- Membrane fouling
RO recovery and permeate quality decline slowly as membranes foul.
- Reuse assumed
Reclaimed volumes are estimated from design capacity, not measured flow.
Why reuse is becoming a measured obligation
minimum water recycling for new wafer fabs in Singapore from 2024, with key usage areas metered.
Source: Singapore PUBcountries holding a quarter of the world's population face extremely high water stress.
Source: WRI Aqueduct 4.0, 2023of water withdrawal projected for AI demand in 2027.
Source: Li et al., 2025 (preprint)From plant to reuse record
Meter in and out
Flow meters on STP inlet and treated outlet, and on RO feed, permeate and reject.
Add quality
TDS in and out on the RO and BOD out on the STP, read alongside flow.
Alert on drift
Recovery, efficiency and quality are tracked against each plant's own normal range.
Report reuse
Recycled volume comes from meters, ready for disclosure and water efficiency plans.
Plant metrics to track daily
| Metric | What it tells you | Act when |
|---|---|---|
| RO recovery | Membrane condition and reject losses | It falls below the plant's normal range. |
| TDS in and out | Permeate quality | Out-TDS rises at the same feed quality. |
| STP efficiency and BOD out | Treatment performance | BOD out trends upward. |
| Reuse flow against design | How much water is actually reused | Reuse falls below plan. |
sites in 21 countries run on Aqueduct.
and 9 clinics in one of India’s top hospital chains.
US airport running water intelligence on Aqueduct.
of commercial real estate under Aqueduct.
FMCG manufacturing campus.
operations run on Aqueduct.



Related
Common questions
No. Aqueduct monitors and alerts. Operation stays with your plant operator or contractor, who gets alerts when RO recovery or STP efficiency drifts away from its normal range. See aQ WaterGuard.
Sewage treatment plants, RO units and reclaimed water lines, built into the site's water twin as they are installed. A site without one is not modeled with one. See digital twins.
Yes. Recycled and reused volumes export per period from meters, which suits disclosures such as revised ESRS E3 that ask for recycled and reused water. See ESG and sustainability reporting.
RO recovery and permeate quality decline slowly as membranes foul. Aqueduct trends recovery and TDS continuously, so the drift shows before the next manual log would. See CIP and process water.
See Aqueduct on your own facility.
Bring a site, a utility bill or a question. We will show you where the loss is.