
Load disaggregation that splits the main meter into the uses that drive it.
A main meter says how much a site used, not where. Aqueduct splits it with sub-meters on feeders and equipment, then closes an energy balance: grid, solar and backup in must equal HVAC, lighting, plugs, services and losses out.
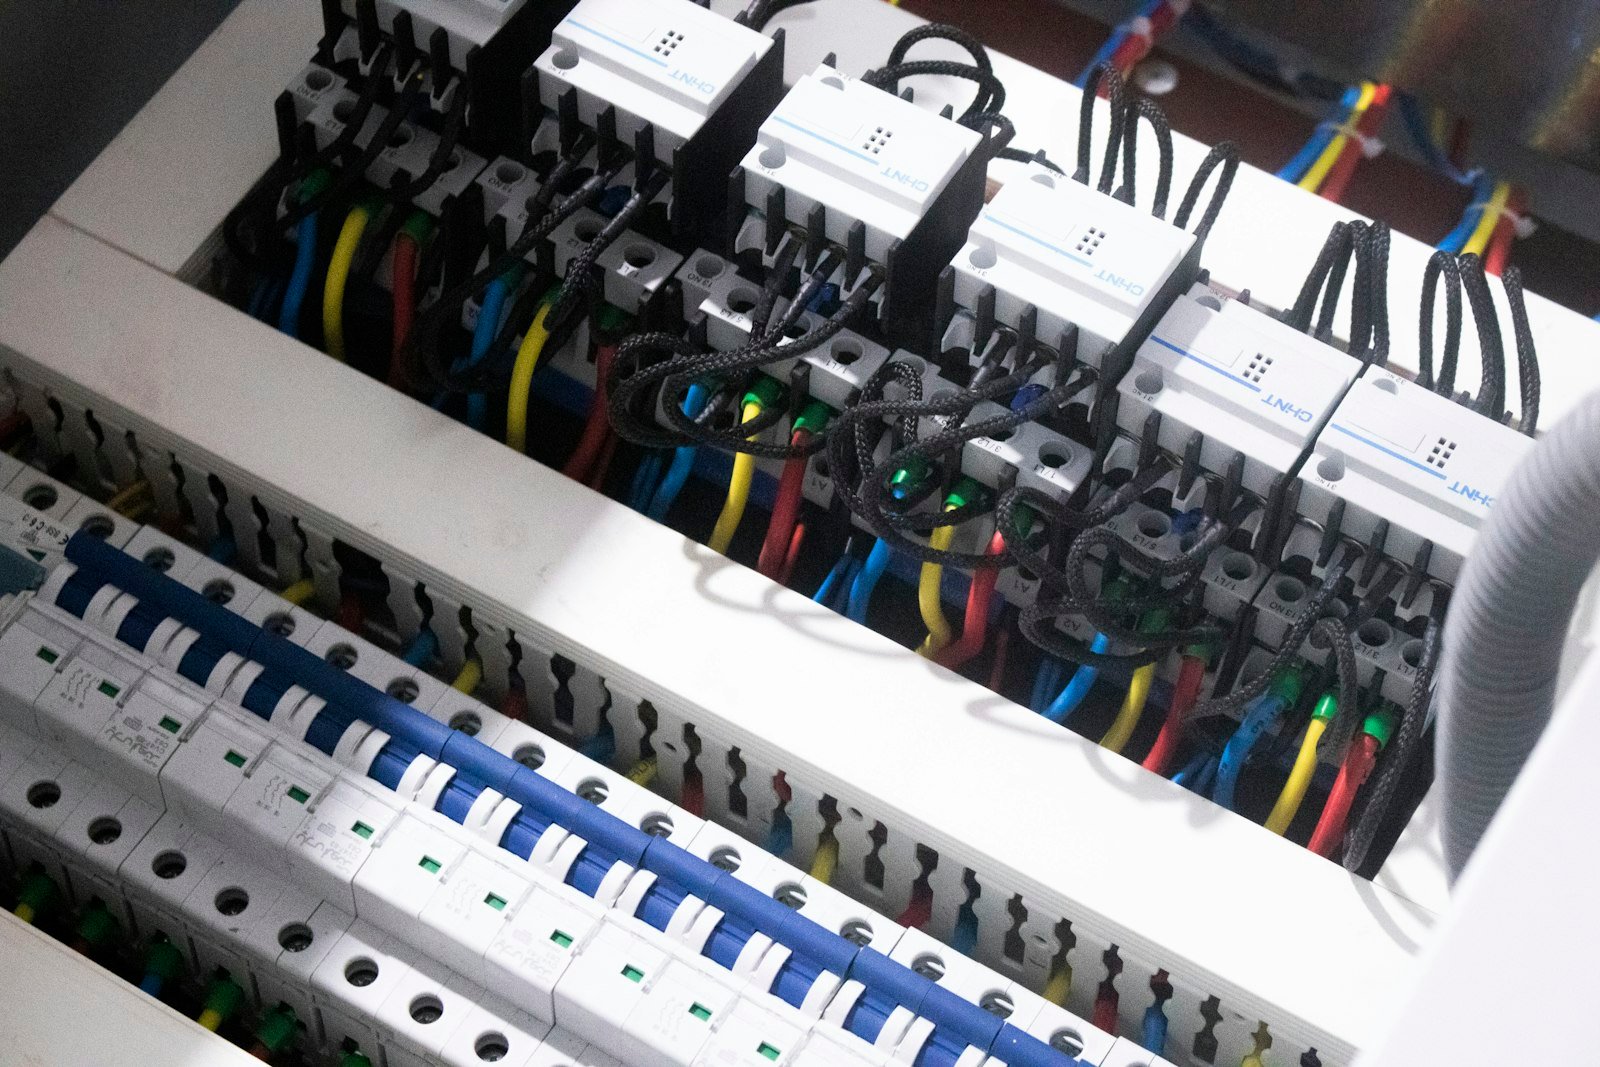
Every kilowatt on the main meter assigned to a feeder, a use or a loss.
How the split is made
- Sub-meters on feeders
Meters on HVAC, lighting, plug and process feeders, and on large single loads such as a rooftop unit.
- An energy balance
Sources in equal uses out plus losses, so unmetered load appears as a residual instead of disappearing.
- Coverage shown
The share of the main meter that sub-meters explain is displayed next to every breakdown.
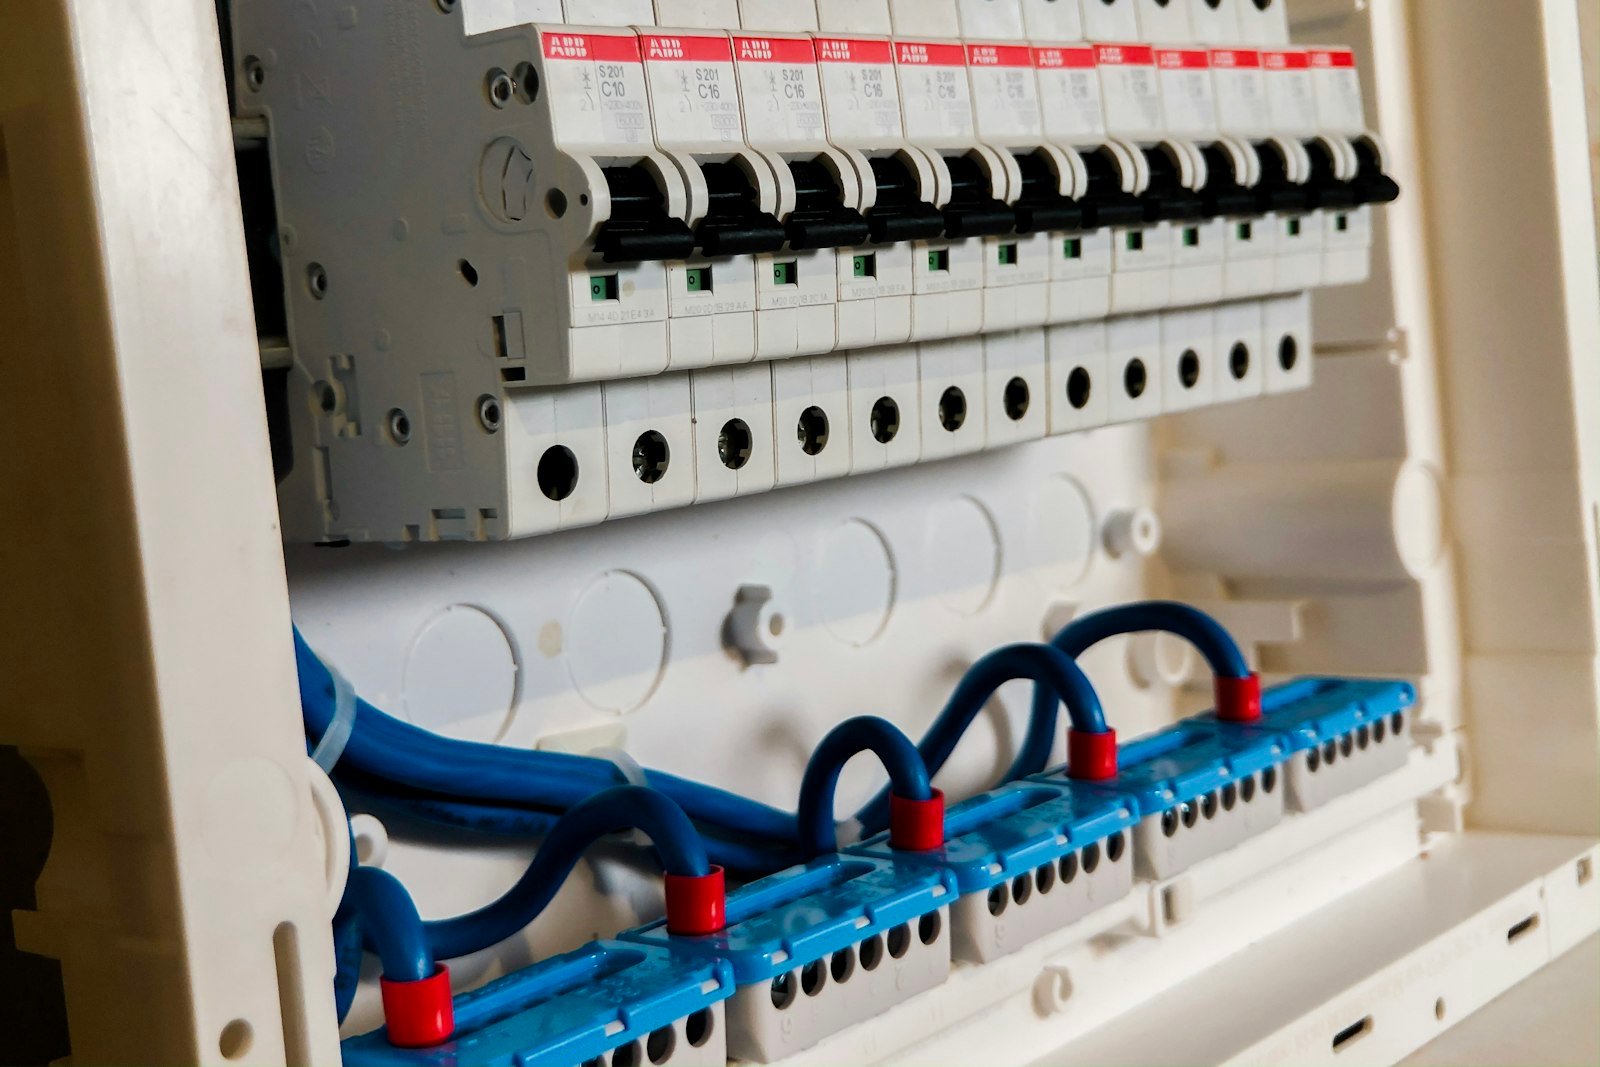
Use by purpose, time and area
- End-use breakdown
kWh per use and per floor, by hour, day and month.
- Base load
The minimum draw when the site should be idle, often the first place waste is found.
- Sankey view
Energy drawn from source to final use, for people who read flows faster than tables.
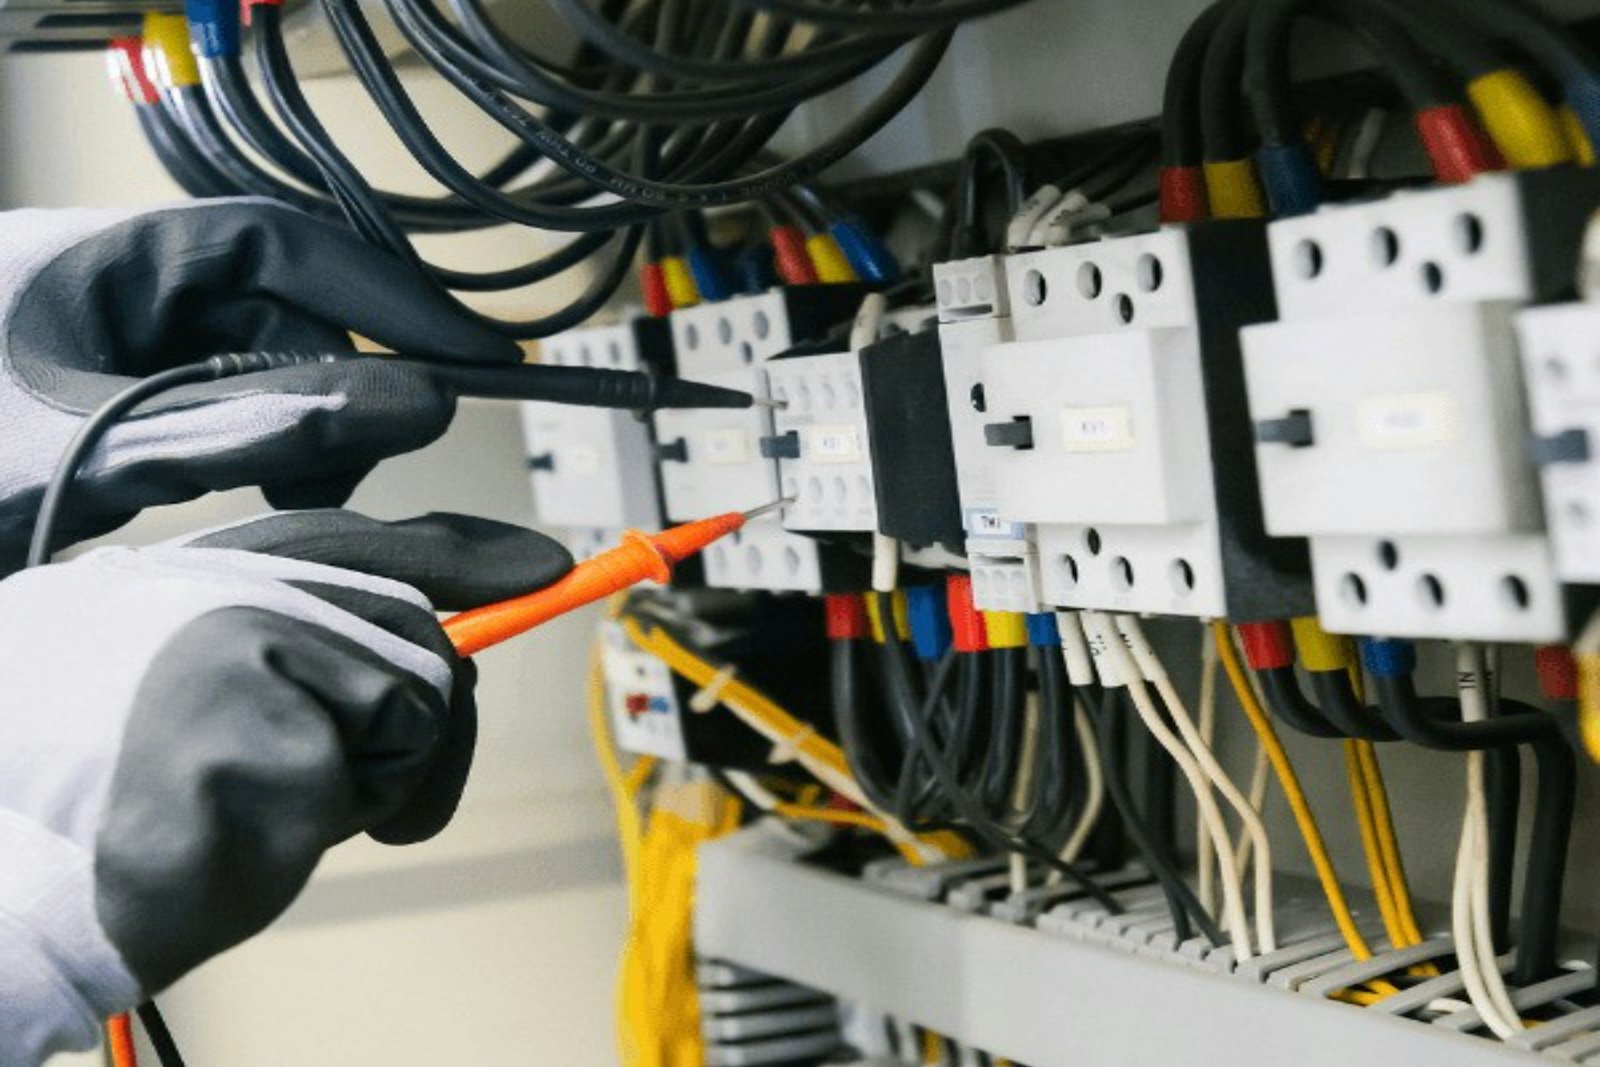
Where commercial energy goes.
of US commercial building energy went to ventilation in 2018, and about the same to lighting.
Source: US EIAper sq ft was average US commercial energy intensity in 2018, down from 80,000 in 2012.
Source: US EIAAn example
Illustrative: an office's main meter shows a flat 140 kW overnight. The balance assigns 60 kW to plug feeders on two floors and 45 kW to an air handler running a weekday schedule through the weekend. The remainder is too small to chase.
Limits
This is metered disaggregation, not inference from one signal, so it is only as detailed as the sub-metering. Loads on an unmetered circuit appear together in the residual.
Adding sub-meters to an existing switchboard needs an electrician, and installation runs through partners.
Related
Common questions
No. Non-intrusive load monitoring infers loads from one meter with an algorithm. Aqueduct uses sub-meters on feeders and large equipment, so each figure is measured, and the unmetered remainder shows as a residual. See electricity meters.
Start with the feeders that carry the most load, usually HVAC, then lighting and process. Aqueduct shows the share of the main meter that sub-meters explain, so you can see when the unexplained residual is small enough. See sub-metering by production line.
Yes. Each site carries a grid carbon factor with its source and year, so energy for each use also reads as CO2e. That lets a team show which feeder drives emissions, not only cost. See ESG and sustainability reporting.
Base load is the minimum draw when a site should be idle, such as overnight or on weekends. A high base load in Aqueduct usually means equipment left running, so it is often the cheapest saving to chase. See HVAC energy optimization.
See Aqueduct on your own facility.
Bring a site, a utility bill or a question. We will show you where the loss is.