
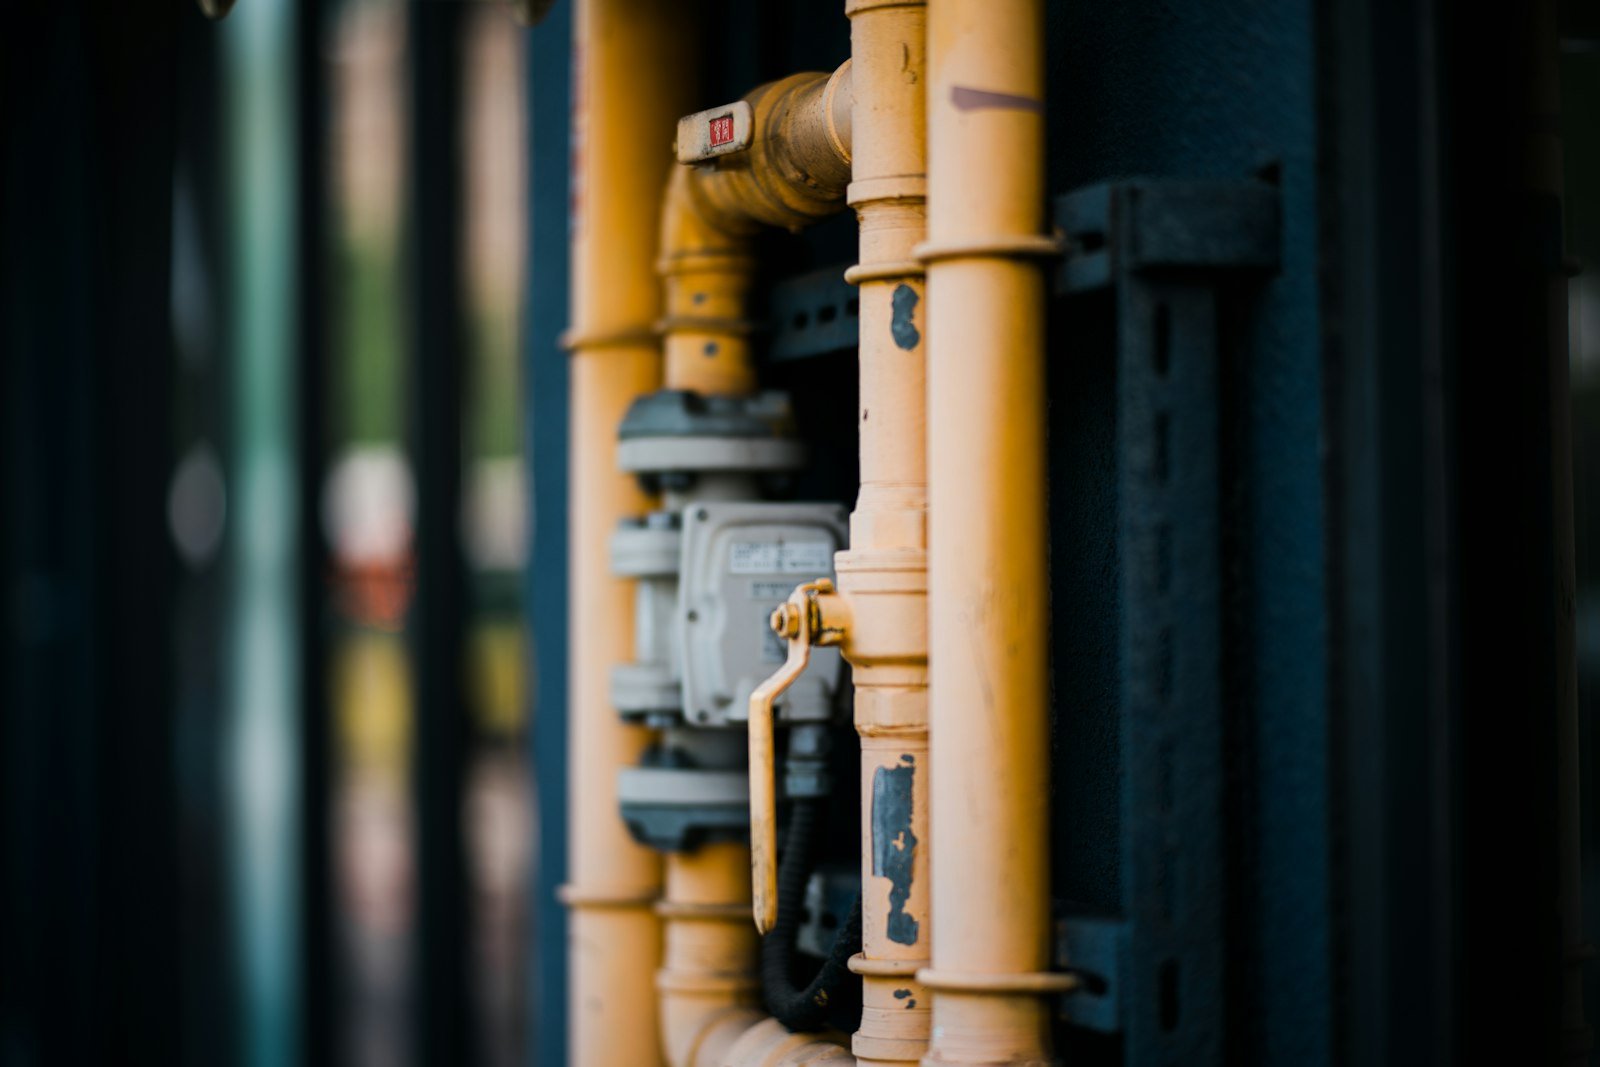
Airport utility monitoring, from the central plant to the gate and the water mains
Airport utility monitoring covers the central utility plant, the preconditioned air and ground power at gates, and the water mains that serve a campus that never closes. Aqueduct measures chiller and boiler efficiency, PCA and GPU use per gate, and a live water balance across terminals, cargo and support buildings, then finds losses, routes fixes and verifies results at the meter.
Why airport utilities are hard to see
A central plant nobody benchmarks
Chillers and boilers serve every terminal, but plant efficiency is a commissioning figure, not a weekly measurement.
Gate equipment left running
Preconditioned air and ground power units keep running after the aircraft has pushed back.
Water mains with no balance
Water spreads across terminals, cargo and support buildings through aging mains, read manually or not at all.
No downtime for change
Nothing can be shut down to install a new system, so anything new must work over what is already there.
Airport utilities Aqueduct measures
| System | Measured | What Aqueduct derives |
|---|---|---|
| Central utility plant | Chiller and boiler power and fuel, BTU meters, pump and tower power, make-up water | kW per ton, plant efficiency, delta T and tower water use |
| Chilled and hot water distribution | Supply and return temperatures and flow by building | Which buildings drive the plant, and low delta T at each |
| PCA and GPU at gates | Power per unit, run status, gate occupancy where shared | Units running at empty gates, energy per turn where data allows |
| Water mains and services | Flow at supply points, building and zone meters, pressure | A live campus water balance with unaccounted loss by zone |
What the numbers say.
of a facility’s water use can be lost to leaks.
Source: EPA WaterSense, getting startedfrom one leaking toilet wastes 21,600 gallons a month.
Source: EPA WaterSense at WorkSources2 references cited on this page
Related
Common questions
By metering supply points and building or zone meters, then reconciling supply against use continuously. When the balance stops closing, the gap is unaccounted loss with a location. Aqueduct runs this live across the campus instead of waiting for manual reads.
Preconditioned air, or PCA, supplies conditioned air to a parked aircraft, and a ground power unit, or GPU, supplies electrical power, so the aircraft can avoid running its auxiliary power unit. Aqueduct meters both per gate and flags units left running at empty gates.
Yes. Aqueduct calculates kW per ton and plant efficiency from chiller, pump and tower power against cooling delivered from BTU meters, and tracks delta T by building so the loads that drive the plant are visible.
Yes. Aqueduct tracks chilled water supply and return temperature and flow for each building, so buildings returning water too cold are listed. Low delta T forces extra pumping and more chillers online, which shows up as rising kW per ton at the plant.
See Aqueduct on your own facility.
Bring a site, a utility bill or a question. We will show you where the loss is.