
How to reduce peak demand charges and power factor penalties
A demand charge is set by the highest interval of the billing period, often a few minutes when chillers, kitchens and process loads start together. Aqueduct tracks kW against your target as it builds, shows which feeder drives it, and staggers loads before the peak lands.
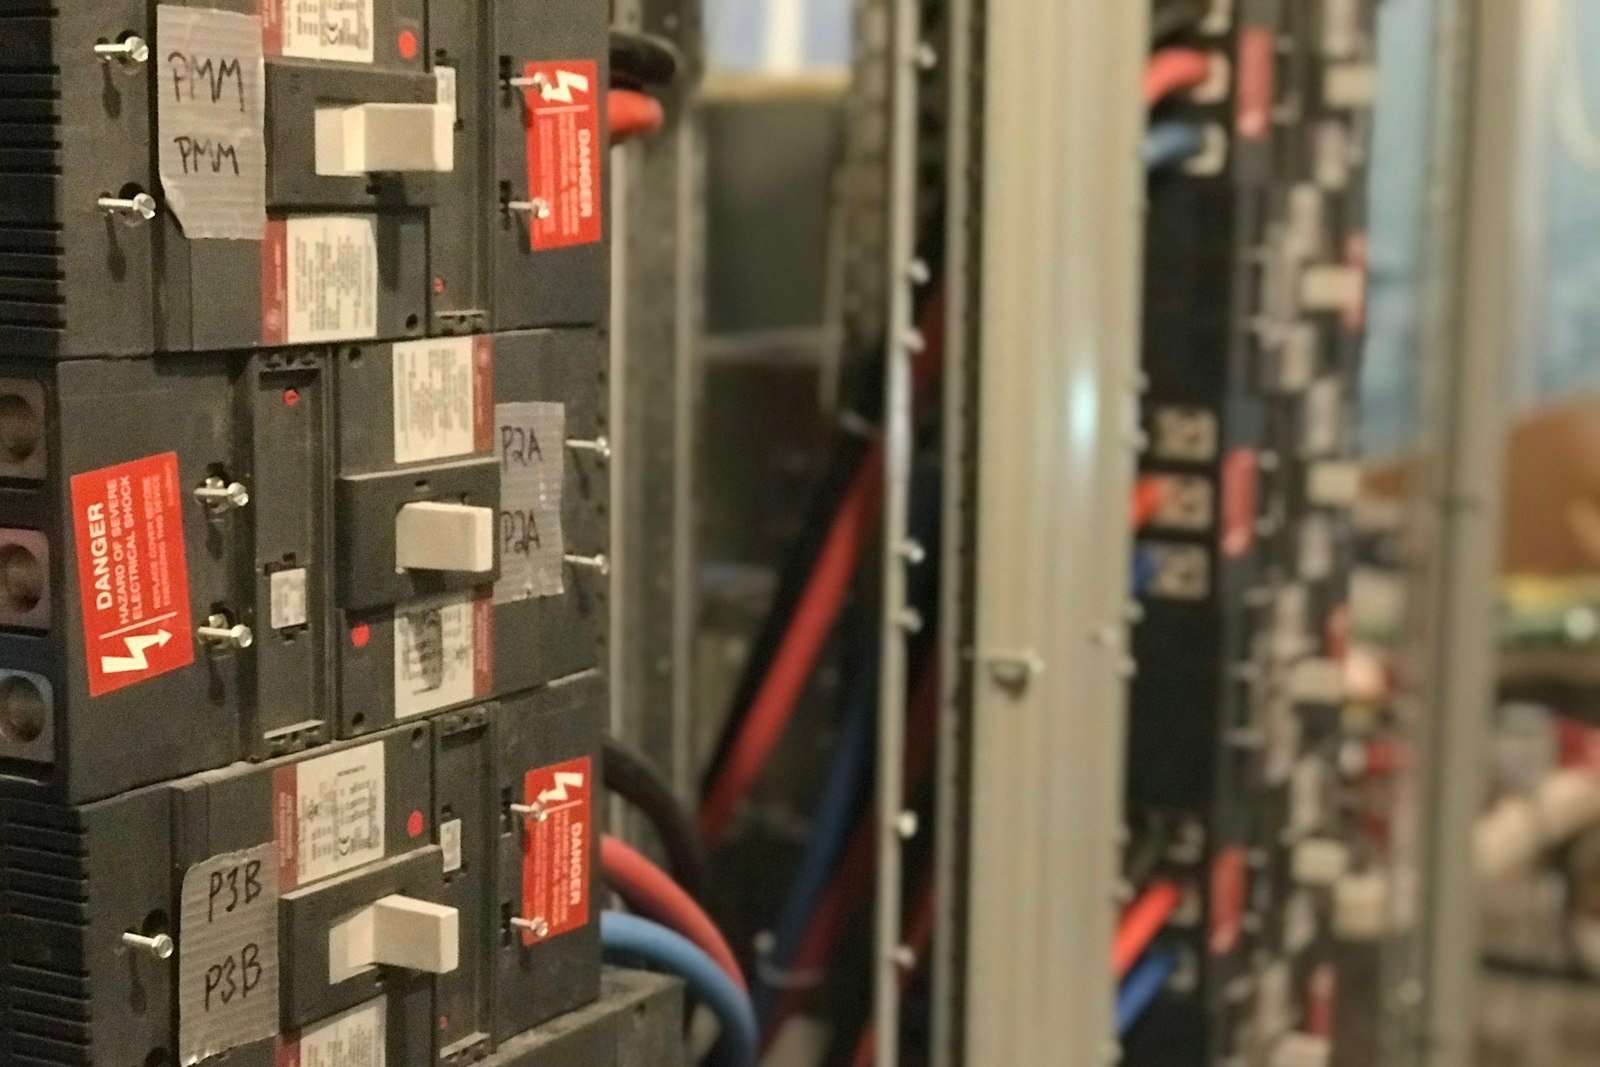
One busy quarter hour can set the price of a whole month.
How a peak gets set
- Coincident starts
Refrigeration, HVAC and process loads start in the same window after a shutdown or at opening time.
- Invisible until the invoice
The peak is recorded by the utility meter and reported weeks later, after nothing can be done.
- Poor power factor
When current and voltage drift out of phase, apparent power rises and the site pays for capacity it does not use.
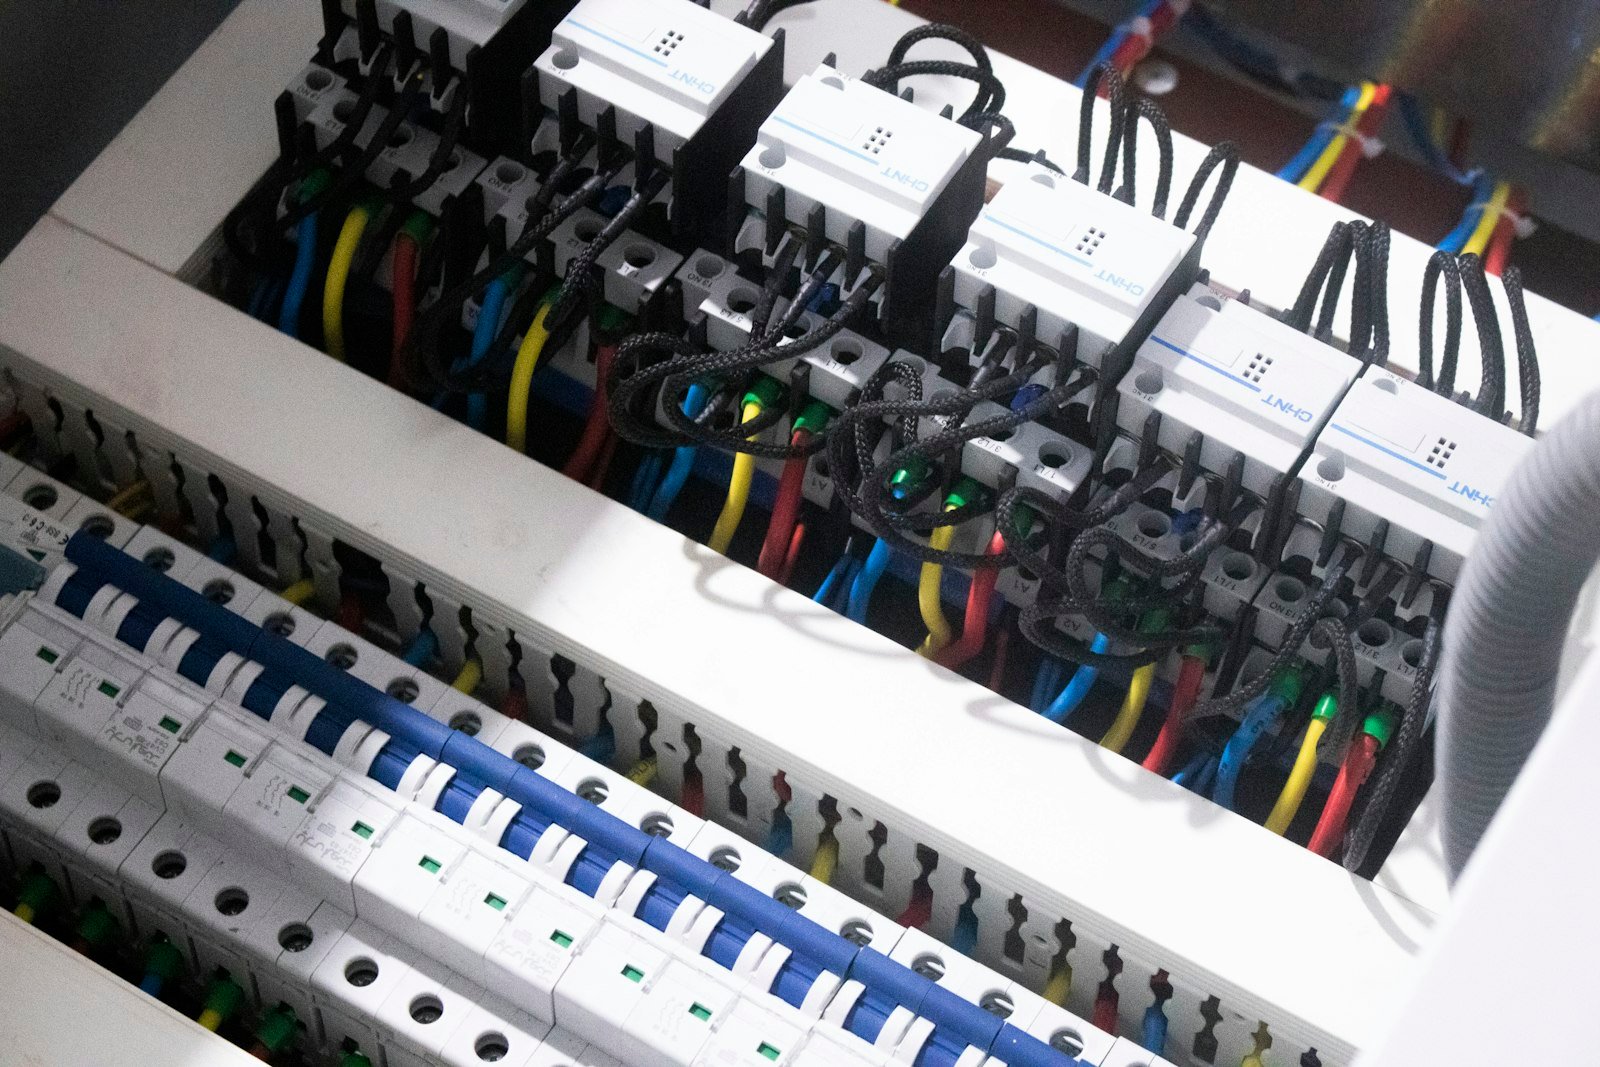
Why demand deserves its own watch
US commercial customers were eligible for tariffs with demand charges above $15 per kW.
Source: NREL and Clean Energy Group, 2017utility tariffs were reviewed to reach that figure.
Source: NREL and Clean Energy Group, 2017a year growth in global electricity demand is forecast to 2027, tightening peak capacity.
Source: IEA Electricity 2025Staying under the band
Set the target
Contracted demand and tariff bands go into rate configuration, so every interval is judged against what it costs.
Watch the build
Facility kW and kVA are tracked live on the electrical digital twin, feeder by feeder.
Sequence the loads
Starts are staggered and non-critical loads delayed in a set priority order, where control is enabled, with owner approval. Critical loads are never shed.
Correct power factor
Feeders with poor power factor or high loading against rated kVA are flagged for correction.
Demand metrics worth a daily look
| Metric | What it tells you | Act when |
|---|---|---|
| Peak interval demand against target | How close the month is to a new band | It passes your warning threshold. |
| Peak driver by feeder | Which load sets the peak | One feeder repeats as the driver. |
| Power factor per feeder | Reactive penalty exposure | It falls below your tariff threshold. |
| Loading against rated kVA | Infrastructure headroom | A feeder runs near its rating. |
sites in 21 countries run on Aqueduct.
and 9 clinics in one of India’s top hospital chains.
US airport running water intelligence on Aqueduct.
of commercial real estate under Aqueduct.
FMCG manufacturing campus.
operations run on Aqueduct.





Related
Common questions
No. Load sequencing works on its own. Where batteries, solar or backup generation exist, they appear on the electrical twin and can be scheduled against the peak. See peak demand management.
Interval data from the main meter at minimum. Sub-meters on major feeders show which load drives the peak, and the bills supply the tariff so each avoided kW is priced. See electricity meters.
As peak interval demand against target for each billing period, with each sequencing action recorded in command history. Finance can match the result to the demand line on the invoice. See for CFOs and finance teams.
Aqueduct shows power factor per feeder and where the reactive penalty comes from, so correction equipment goes where it pays. Your electrical contractor fits it; Aqueduct then measures the change. See power factor.
See Aqueduct on your own facility.
Bring a site, a utility bill or a question. We will show you where the loss is.