Best water utility intelligence platform
 Milvian AI teamFacilities and infrastructure intelligence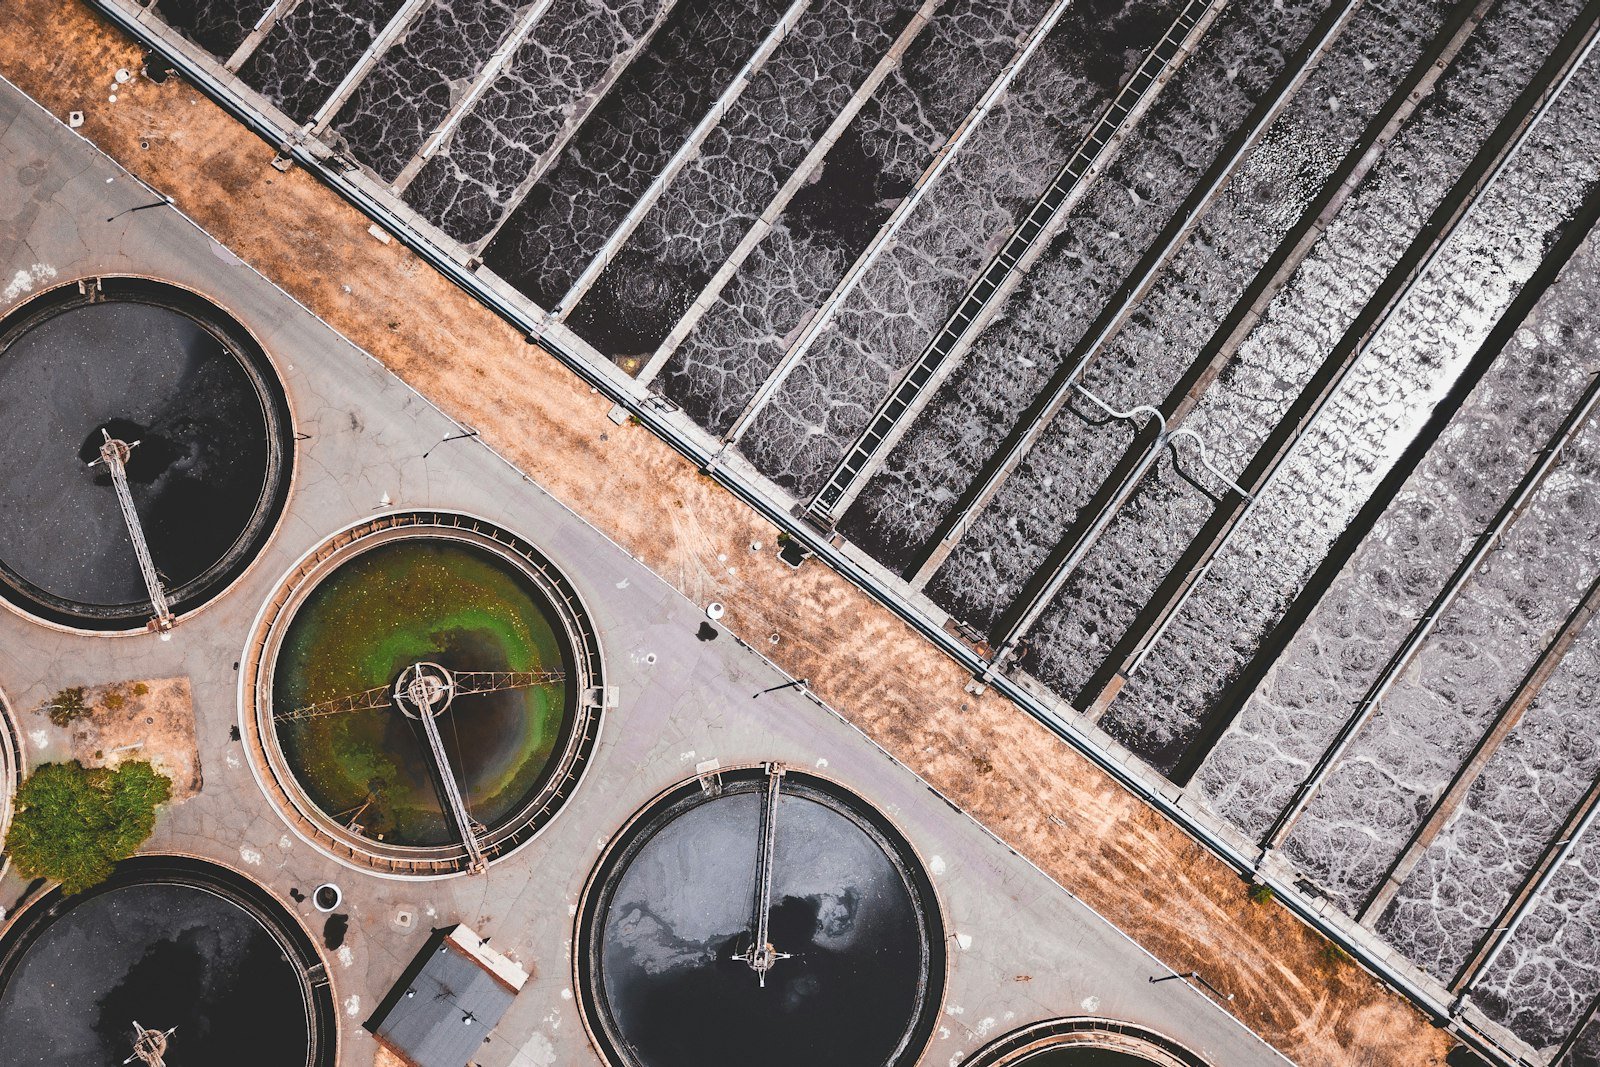
A utility needs a platform that turns SCADA and meter data into a water balance by district, a cost per cubic meter pumped, and a ranked list of losses. Control stays with SCADA.
Why a network is a hard case
A water utility moves treated water through pumping stations, reservoirs and thousands of kilometers of pipe to meters it reads monthly or quarterly. The gap between water produced and water billed is non-revenue water: leaks, bursts, meter error and unbilled use. SCADA controls the network but rarely explains where that gap sits.
Energy is the other big line. EPA notes that drinking water and wastewater plants are often a city's largest energy users, at 30 to 40 percent of the energy a municipality consumes, and that efficiency practices can save 15 to 30 percent.
What the platform must do
| Requirement | Why it matters here | Ask the vendor |
|---|---|---|
| Balance each district. | Losses must be located before they are fixed. | Can you run a balance per district metered area? |
| Price pumping energy. | Energy per cubic meter shows inefficient pumps and schedules. | Can you report kWh per cubic meter by station? |
| Follow treatment efficiency. | Plant losses and energy belong in the same view. | Do you track treatment plant inlet, output and efficiency? |
| Work beside SCADA. | Control and safety stay with SCADA. | How do you read SCADA without writing to it? |
Standards and direction
The AWWA M36 water audit method is the common basis for non-revenue water reporting in North America, and several US states require validated audits. Prices are rising: US household water and sewer bills rose 5.1 percent in 2025 and 24.2 percent over five years. Water stress adds pressure: WRI projects 31 percent of global GDP will face high water stress by 2050.
How to evaluate one
- Pick two districtsOne with good metering and one with suspected losses.
- Close the balanceInflow against billed and estimated use, by day.
- Add pump energyMeter one pumping station and report energy per cubic meter.
- Rank the lossesPrice each by production cost and lost revenue.
Where Aqueduct fits
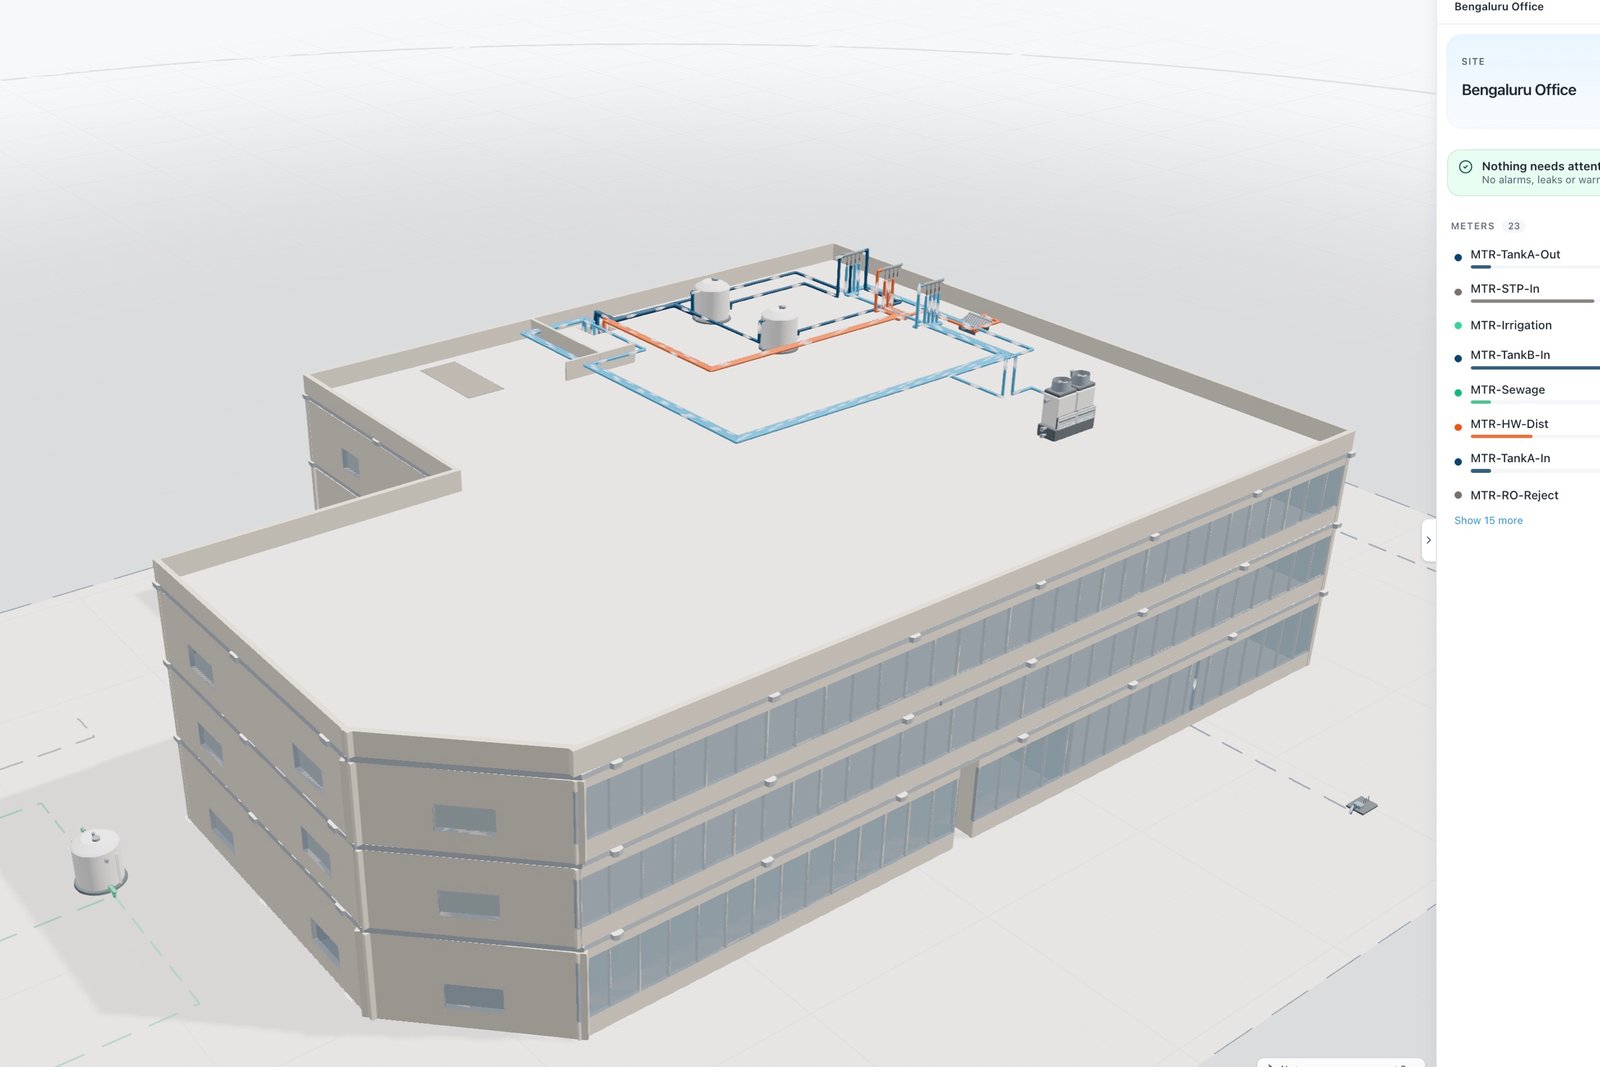
Aqueduct reads SCADA tags, bulk meters and pump power into aQ Core and leaves control with SCADA. aQ WaterGuard solves the balance per district and plant, with treatment inlet, output and efficiency on the same schematic, and aQ EnergySmart measures pumping energy and power factor per station. Findings route to the utility's work order system.
Sources
| Source | Link |
|---|---|
| US EPA, Energy Efficiency for Water Utilities | epa.gov |
| Bluefield Research via Water Online, 2026 | wateronline.com |
| World Resources Institute, Aqueduct 4.0, 2023 | wri.org |