Best energy management system for data centers
 Milvian AI teamFacilities and infrastructure intelligence
A data center EMS should measure PUE and WUE from meters, not design values. Cooling ties energy and water together, so the same system should cover both.
Energy and water are one problem here
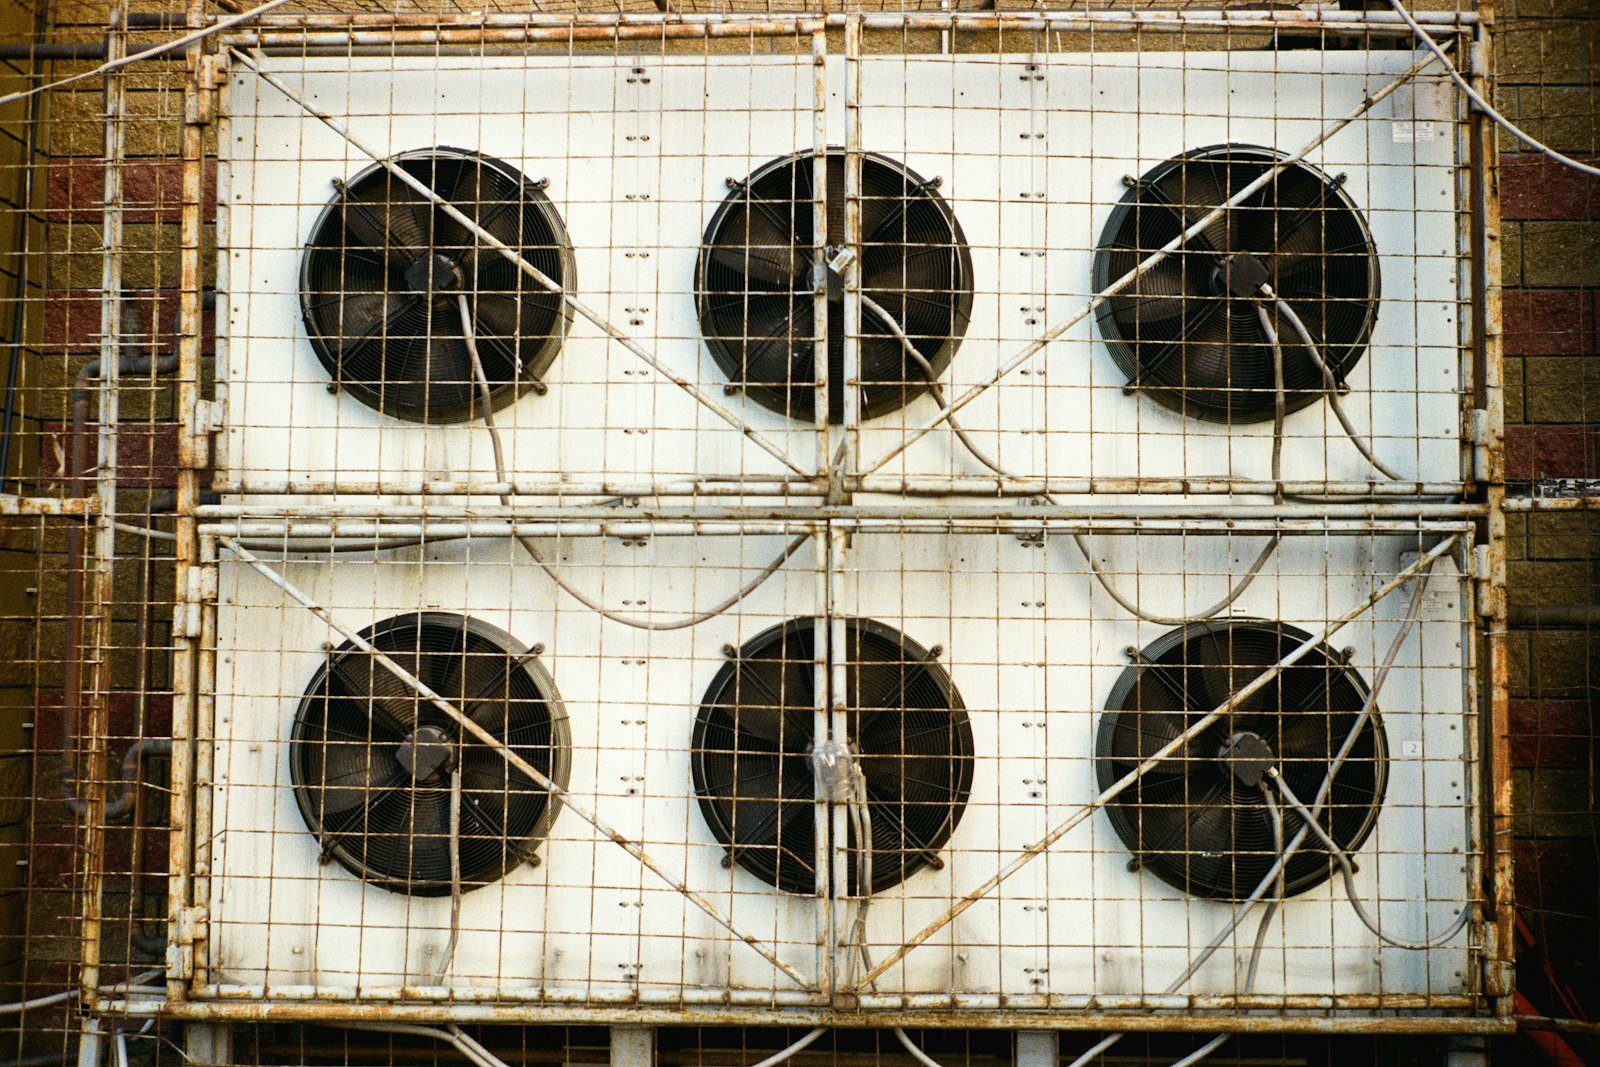
Data centers turn electricity into heat, and most remove that heat with water, either in cooling towers or adiabatic systems. Lowering energy with evaporative cooling raises water use, and the reverse is also true. PUE alone hides that trade.
The scale is large. DOE reported that data centers used about 4.4 percent of US electricity in 2023 and could reach 6.7 to 12 percent by 2028. A 2025 preprint by Li and colleagues projects AI demand could need 4.2 to 6.6 billion cubic meters of water withdrawal in 2027.
Metrics and the meters behind them
| Metric | Definition | Meters needed |
|---|---|---|
| PUE. | Total facility energy divided by IT energy. | Utility incomer plus UPS or PDU output. |
| WUE. | Site water use divided by IT energy. | Make-up water on every tower and adiabatic unit. |
| Cooling energy. | Chillers, towers, pumps and CRAH fans. | Feeder or equipment meters in the plant. |
| Power quality. | Power factor, harmonics and losses. | Power analyzers on main switchboards. |
What the EMS must do
| Requirement | Why it matters here | Ask the vendor |
|---|---|---|
| Report PUE and WUE from meters. | Design values drift from reality within a year. | Show the meter points behind each metric. |
| Track tower cycles. | Blowdown is where tower water is lost. | Do you report make-up, blowdown and cycles? |
| Watch power quality. | Low power factor and losses waste capacity. | Can you show losses and loading per feeder? |
| Separate tenant loads. | Colocation customers pay for their share. | Can you allocate energy per customer? |
Reporting and direction
ISO/IEC 30134 defines PUE and WUE. The EU Energy Efficiency Directive requires larger data centers to report energy and water indicators to a European database. The IEA projects data center electricity rising from about 415 TWh in 2024 to about 945 TWh by 2030, so grid connections and water permits will both get harder.
How to evaluate one
- Audit the meter pointsConfirm the incomer, IT output and tower make-up are all metered.
- Compute last month's PUE and WUECompare with the figures currently reported.
- Find the tower wasteCheck cycles of concentration against the water treatment target.
- Check power qualityReview power factor and losses on main boards.
Where Aqueduct fits
aQ EnergySmart balances grid, solar and generator supply against every feeder in a live single-line twin, with power factor, losses and peak demand per node, and carries the grid carbon factor for emissions. aQ WaterGuard meters tower make-up and any RO or reuse plant. Baselines use past bills and degree days, so a hot month is not mistaken for a worse facility.
Sources
| Source | Link |
|---|---|
| US DOE, LBNL data center report release, December 2024 | energy.gov |
| Li et al., Making AI Less Thirsty (preprint), 2025 | arxiv.org |
| IEA, Energy and AI, 2025 | iea.org |