Best dairy intelligence platform for water and energy
 Milvian AI teamFacilities and infrastructure intelligence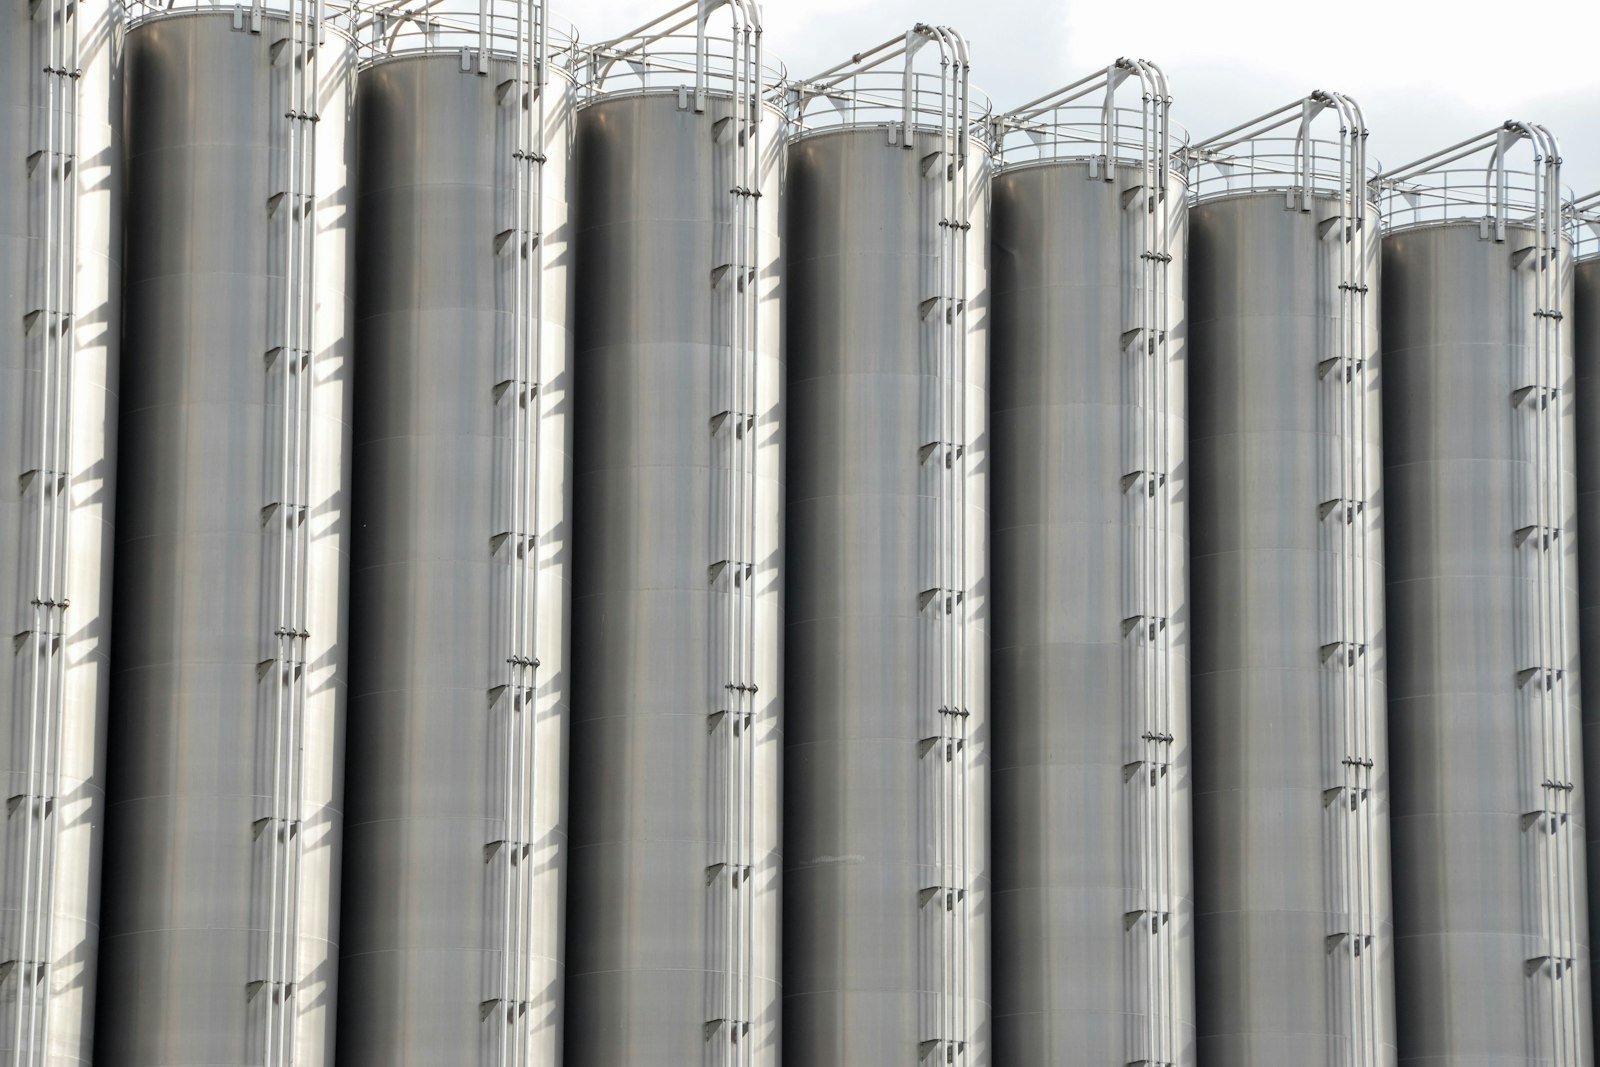
Water and energy in a dairy move together through CIP, pasteurization, refrigeration and effluent. The right platform meters both per line and per liter, and shows reuse from the effluent plant.
Why dairy is a water and energy business
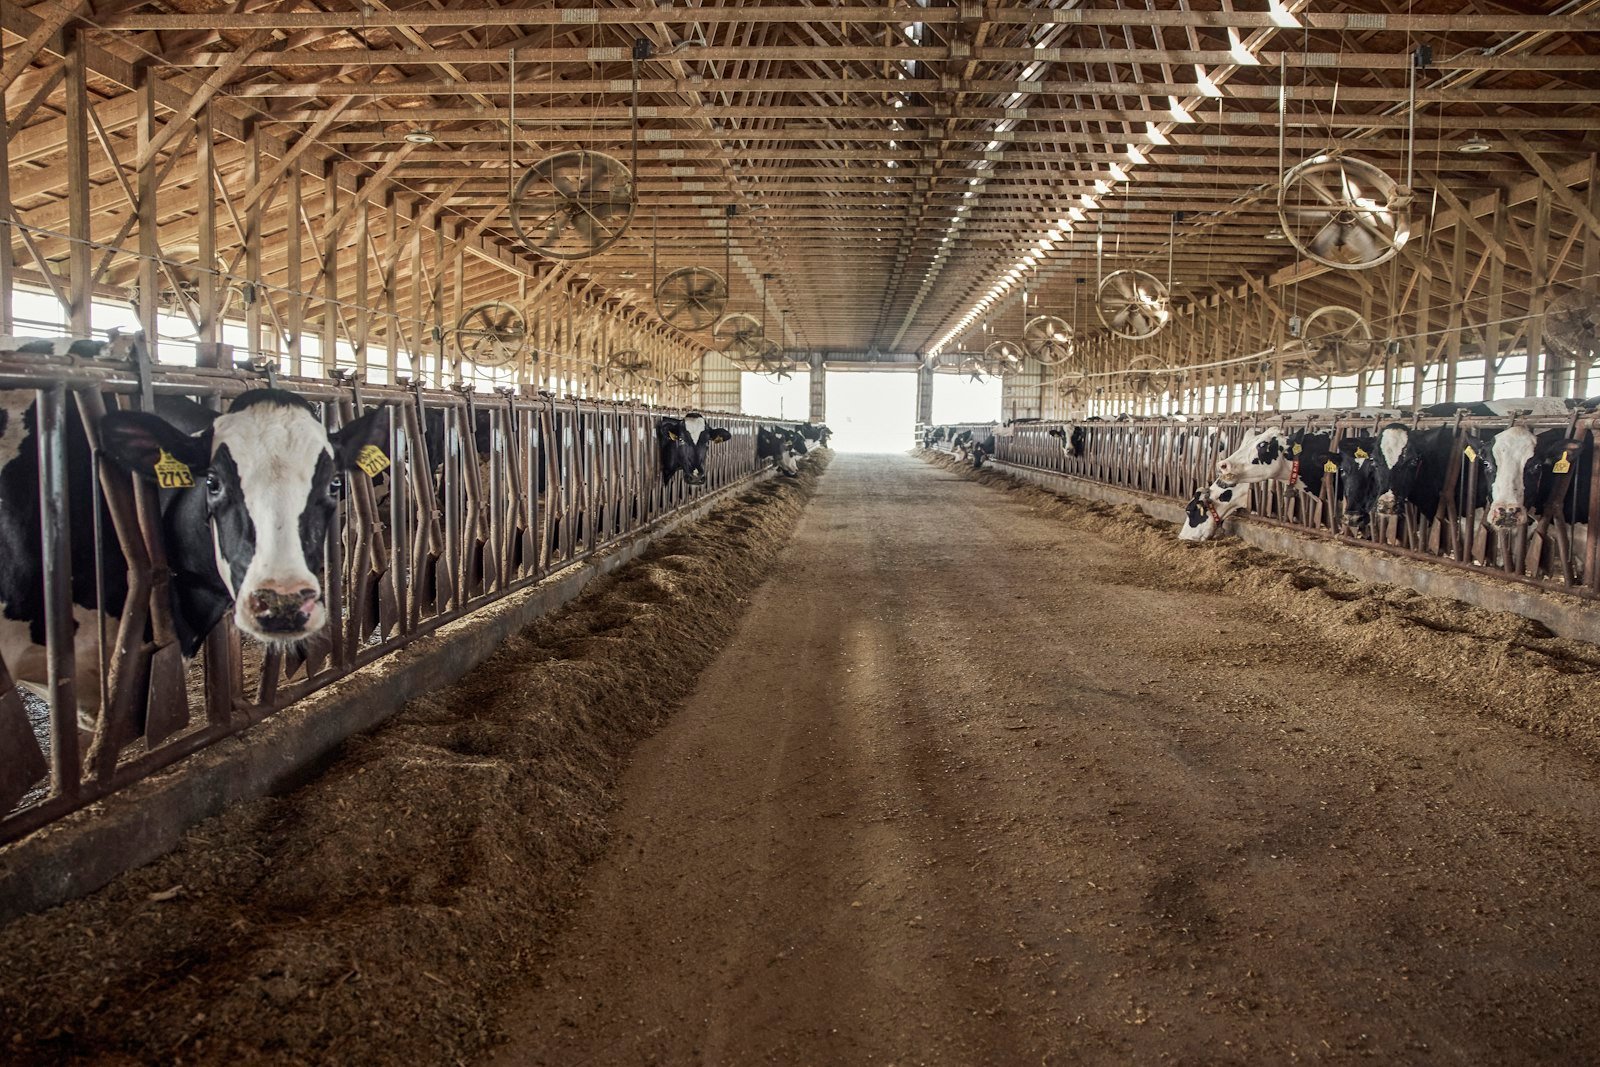
Every CIP cycle uses hot water and chemicals, and every liter of hot water was heated by the boiler. Wash-downs, crate washers and cooling add water use, and nearly all of it ends up at the effluent treatment plant, which uses energy of its own.
Small losses add up in a plant that hoses down daily. EPA's leak table puts a hose left running at 10 gallons per minute overnight at 5,400 gallons a day. Many dairies sit in water-stressed regions: WRI counts 25 countries, home to a quarter of the world's population, facing extremely high water stress.
Process areas and what to meter
| Area | What to meter | What it reveals |
|---|---|---|
| Reception and silos. | Intake volume and chilling energy. | The denominator for every per-liter figure. |
| Pasteurization. | Steam or hot water and regeneration temperatures. | Whether heat recovery is working. |
| CIP. | Water, temperature and duration per cycle. | Cycles that run longer or hotter than validated. |
| Refrigeration. | Compressor power and condenser water. | Drift in efficiency before a failure. |
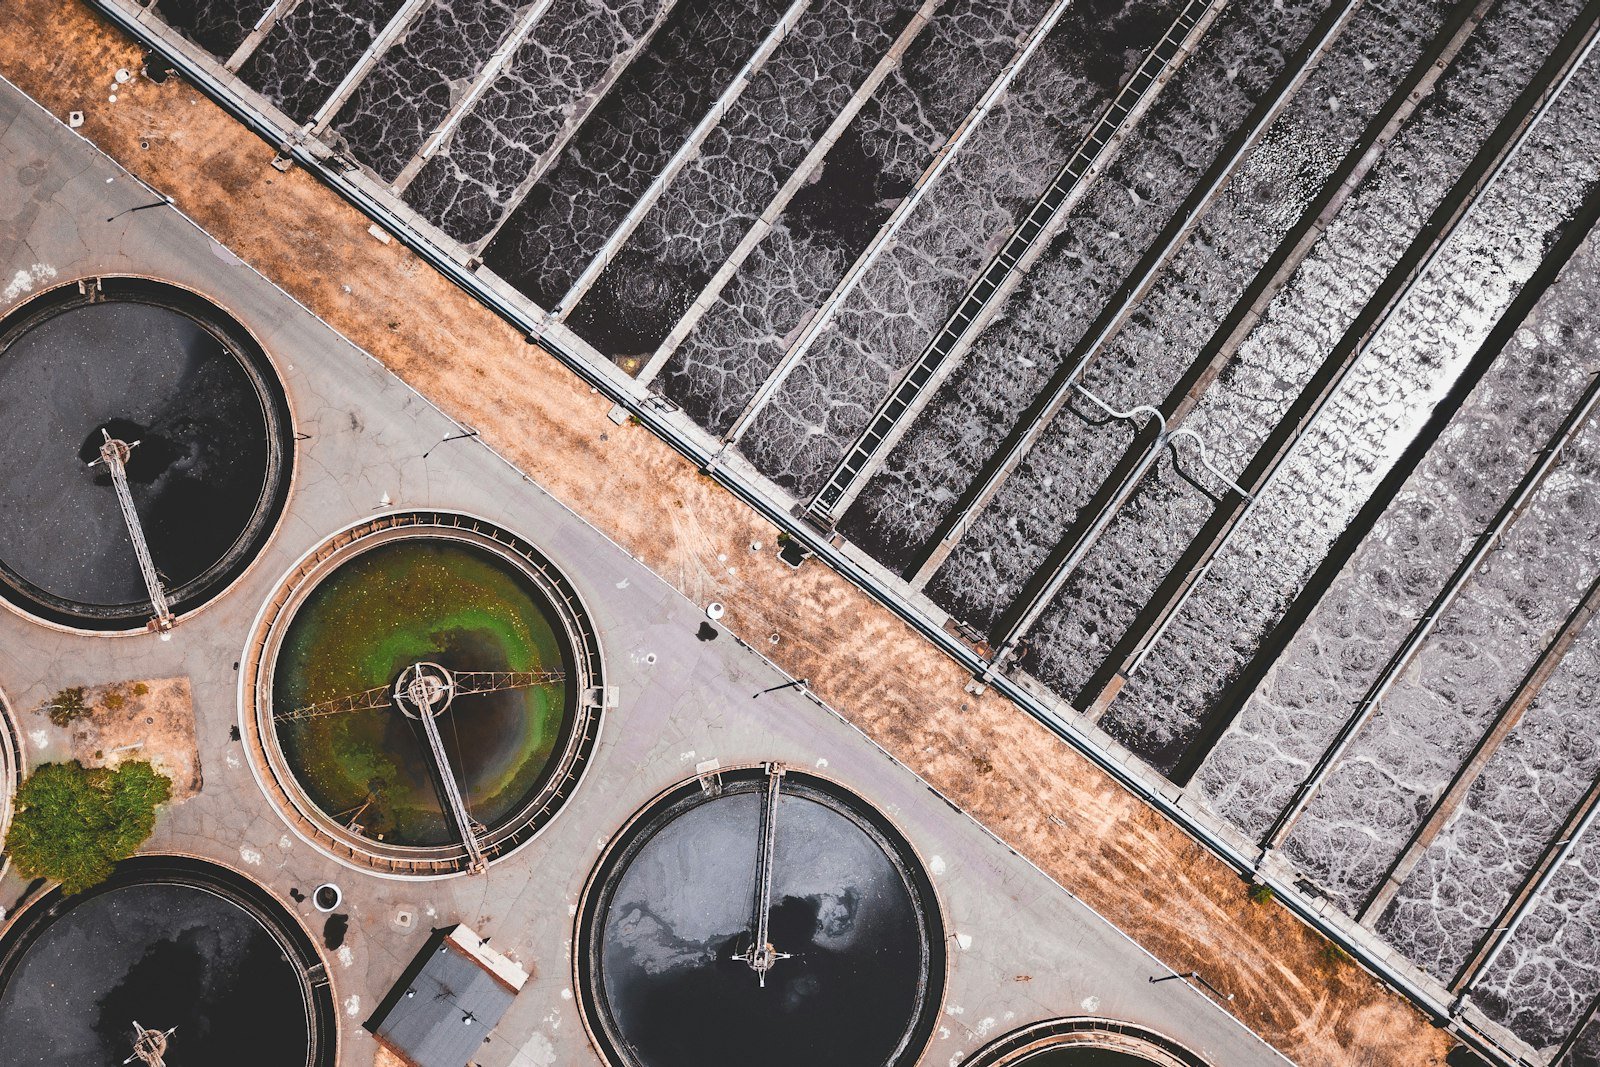
| Effluent plant. | Inlet, treated flow and reuse. | How much water returns to use. |
Reporting and what is next
The revised ESRS E3 asks large processors for consumption, consumption in water-stressed areas, withdrawal, discharge and recycled water, figures an effluent plant can only report from meters. ISO 50001 and ISO 14001 ask for measured baselines and monitoring.
How to evaluate a platform
- Meter one CIP circuitCompare each cycle's water and heat with its validated recipe.
- Add intake volumesReport water and energy per liter from the start.
- Meter the effluent plantInlet, treated and reused flow close the loop.
- Rank the lossesPrice each finding at your water and energy tariffs.
Where Aqueduct fits
aQ WaterGuard draws the plant's water system as a live twin, with RO feed, permeate and recovery and the STP's inlet, treated flow and efficiency on the same schematic. aQ EnergySmart covers refrigeration, boilers and feeders. Both baseline expected use from bills, weather and intake, so each saving appears in money. Aqueduct runs at major dairy operations.
Sources
| Source | Link |
|---|---|
| US EPA, WaterSense at Work, Section 2.3 Leak Detection | epa.gov |
| World Resources Institute, Aqueduct 4.0, 2023 | wri.org |
| EFRAG, ESRS E3 delegated act | knowledgehub.efrag.org |