
Municipal water loss and building energy, managed and verified for cities.
A city loses water between the plant and the bill, and runs dozens of public buildings that benchmarking rules now cover. Aqueduct keeps a balance per district alongside SCADA and AMI, and a weather normalized baseline for every city building.
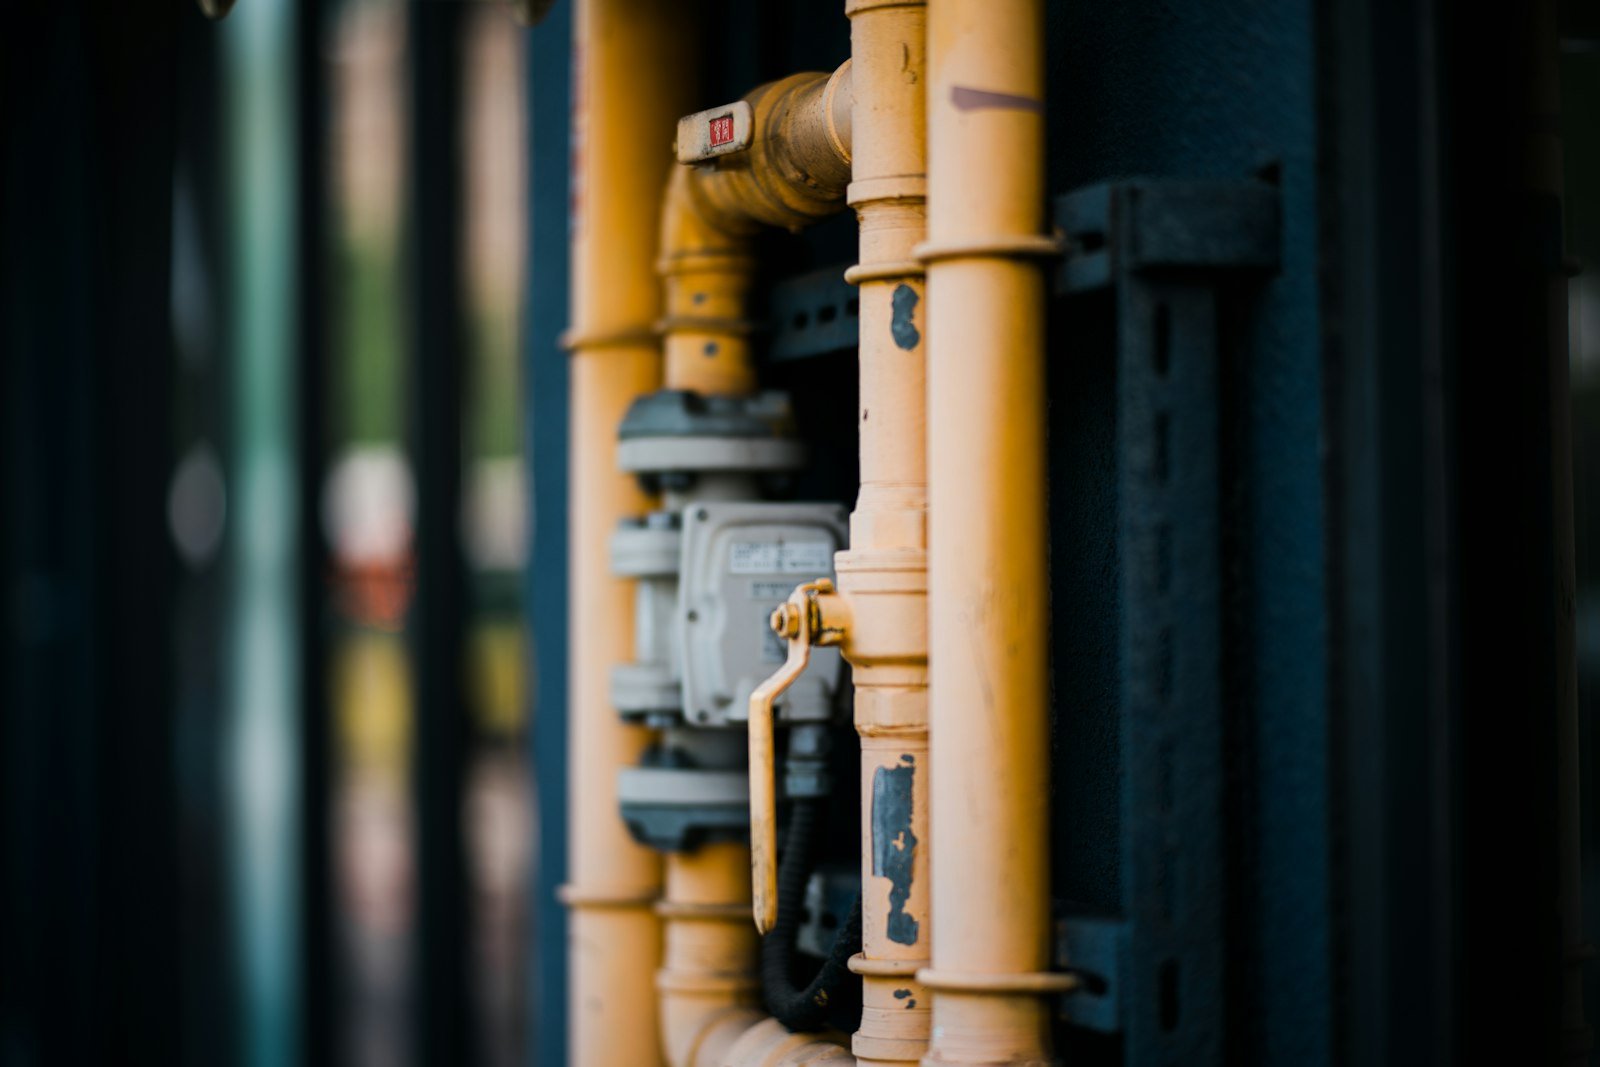
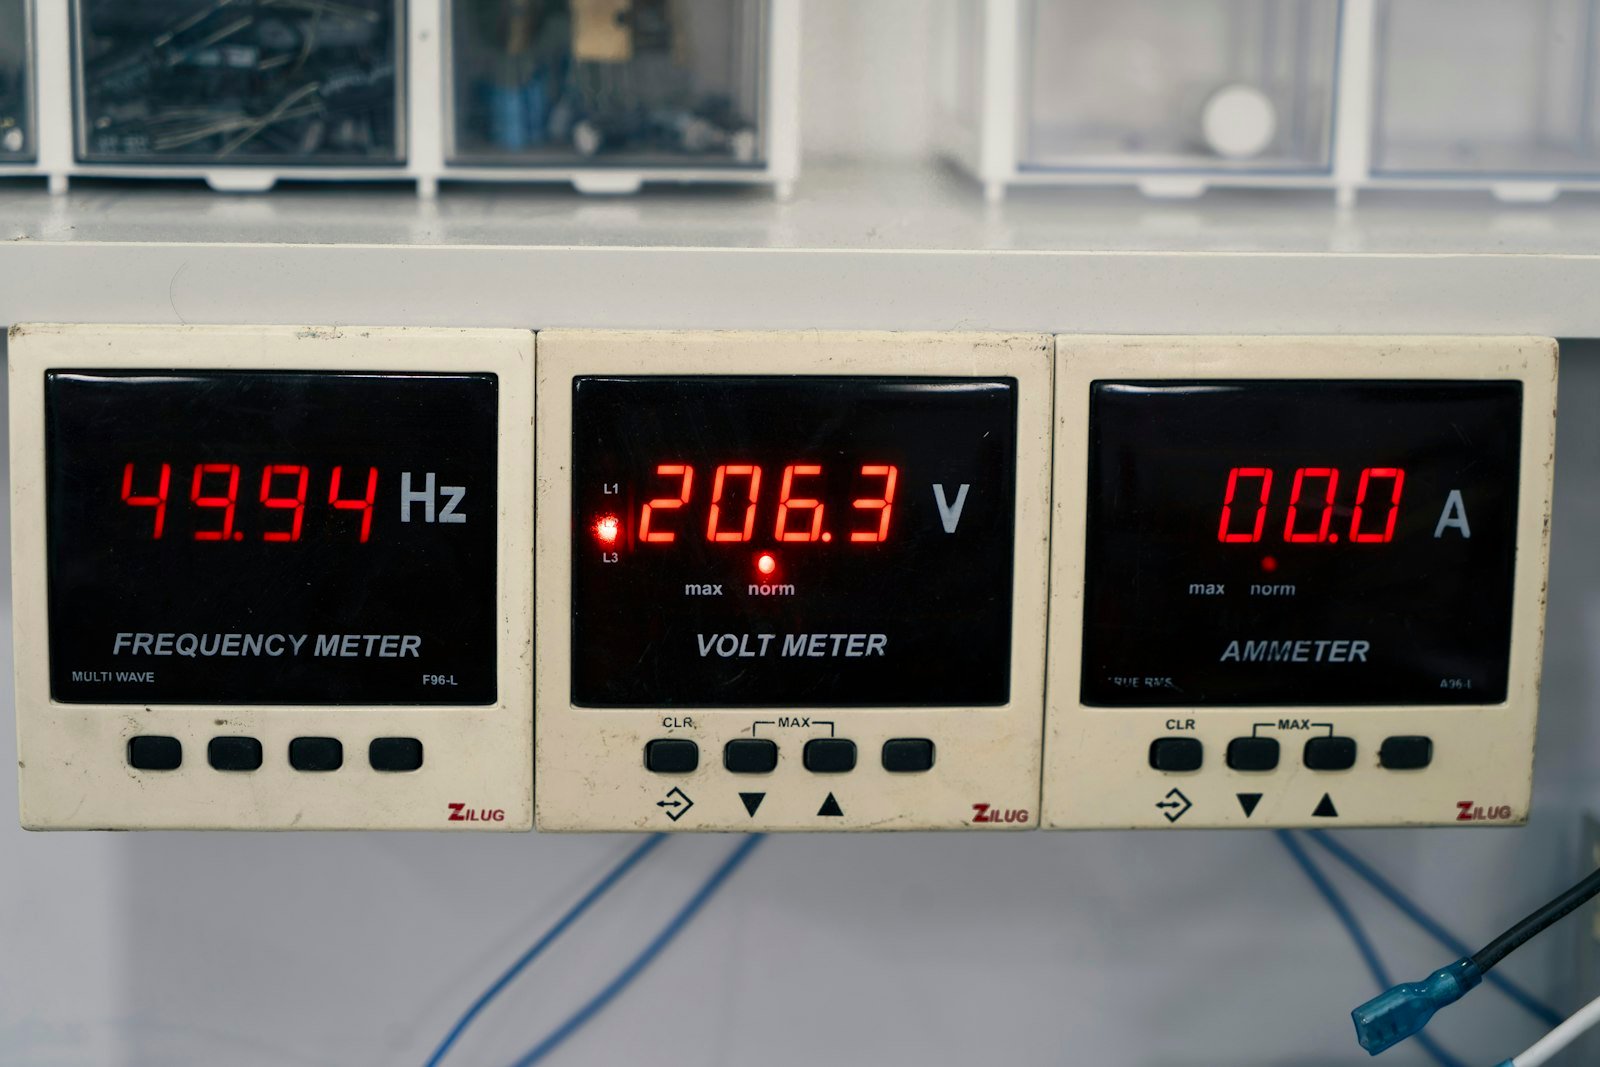
Where a city loses water and energy.
Non-revenue water without an address
An annual loss figure, not a district or a main
Benchmarking built from bills
Building data gathered at the deadline, then forgotten
Public buildings running blind
Libraries, rec centers and offices on fixed schedules
Pump stations
Pumping energy that does not follow demand
What cities are measured against.
CO2e from New York City operations, fiscal 2006 to 2024.
Source: NYC DCAS, December 2025size above which Washington DC owned buildings fall under its performance standard.
Source: DC DOEE, BEPSwater main breaks a year across the US.
Source: ASCE Report Card, 2025City rules with dates.
| Rule or standard | Date | What it asks for |
|---|---|---|
| NYC Local Law 97, city operations | Halve emissions by 2030 | Measured against a 2006 baseline |
| Washington DC BEPS | Six year cycles | City owned buildings over 10,000 sq ft meet a performance standard |
| State water audit rules | Annual in several states | AWWA method balance; see the water loss audit page |
City buildings lead by example.
New York halves city emissions
The city reported its lowest operational emissions in 20 years in December 2025, with the 2030 target still ahead.
Standards reset
DC resets its standard every six years, so buildings that pass today face a higher bar next time.
Sources3 references cited on this page
Related
Common questions
No. Aqueduct reads SCADA, AMI and historian data alongside them, and control of pumps, valves and the network stays with SCADA. Aqueduct adds the district water balance and building analytics that SCADA was never built to provide. See SCADA, AMI and historians.
By balancing each district metered area: inflow from district meters against AMI customer use for the same period. Aqueduct baselines minimum night flow per district, so a rising night flow points crews to the mains in that district first. See district metered areas.
Aqueduct keeps weather-normalized use for each city building current every month, with Portfolio Manager inputs by fuel. Facilities staff see which buildings are off track while there is still time to fix schedules and faults, and your team files with the program. See benchmarking and BPS.
Yes. Aqueduct tracks electricity per volume pumped at each station, so wear or a sticking valve shows as more power for the same water. It also shows which pumps run in peak tariff hours, so schedules can shift where SCADA operators agree.
See Aqueduct on your own facility.
Bring a site, a utility bill or a question. We will show you where the loss is.