Europe starts forcing renovation
The recast EPBD requires the worst-performing 16% of non-residential buildings to be renovated by 2030, and the worst 26% by 2033. Member states had to adopt it by May 2026.
European Commission, EPBD Book a demo
A live single line diagram of grid, solar and backup, every feeder metered, and a baseline that adjusts for weather, so you know what changed, where, and what it cost.
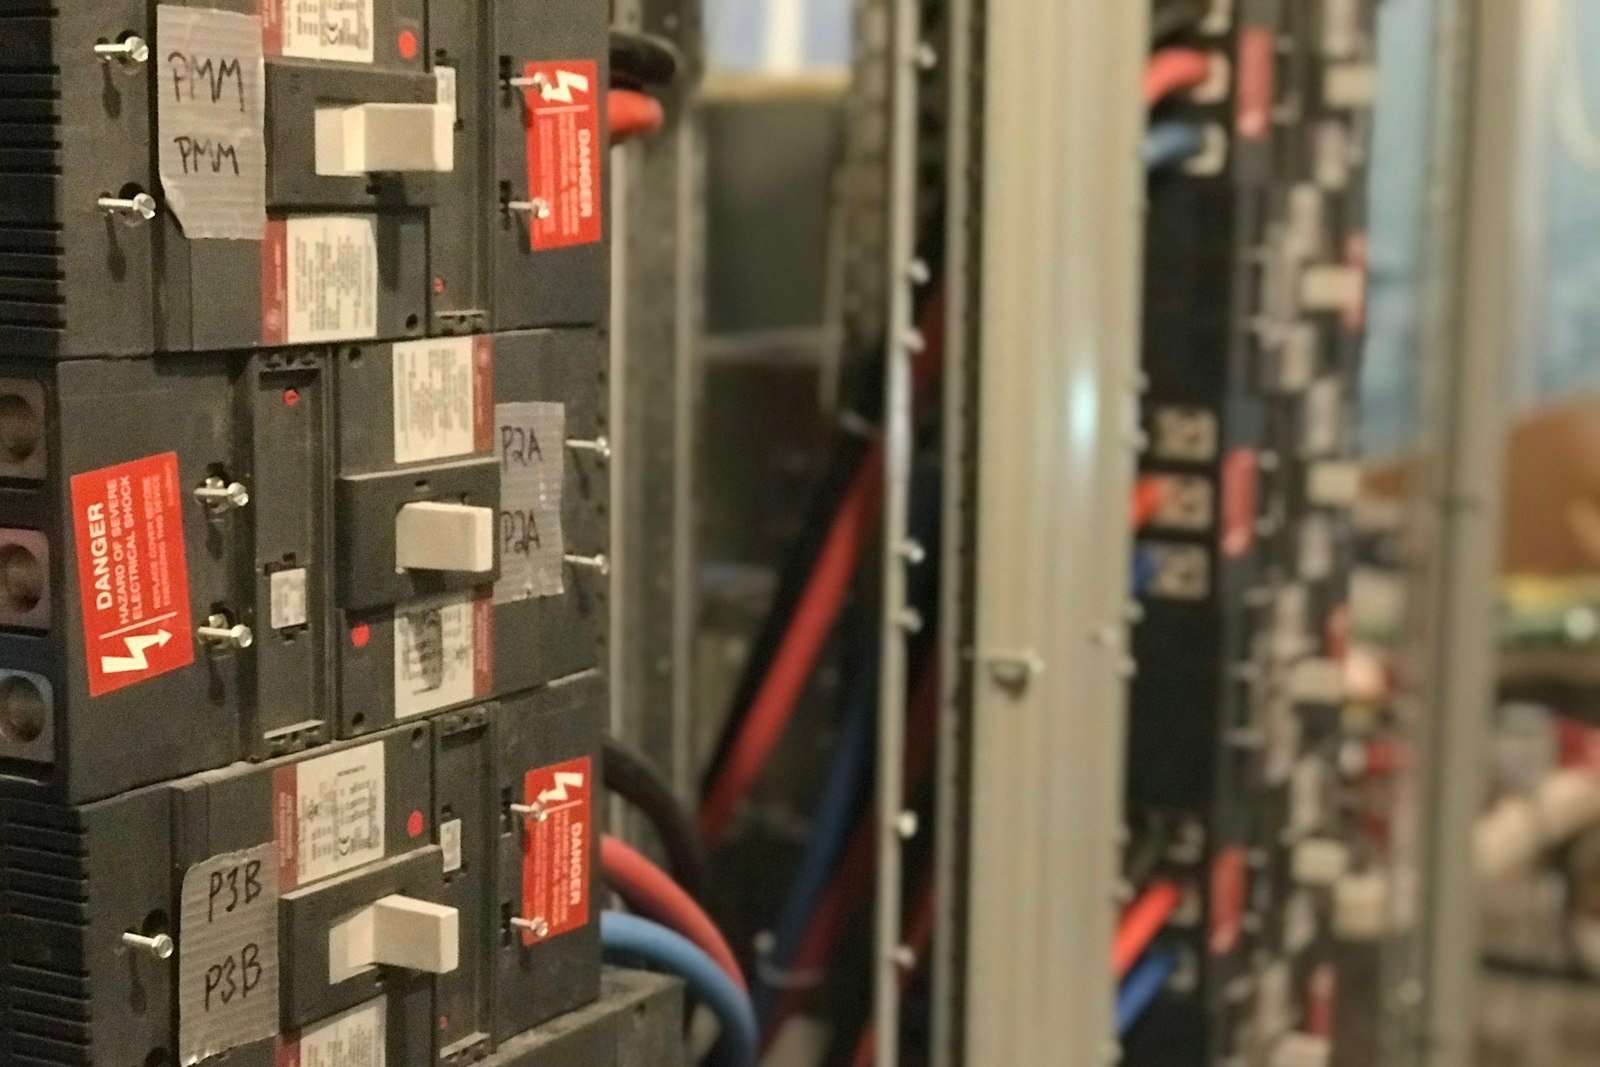
of the energy used in commercial buildings and industrial plants is often wasted through inefficiencies.
ENERGY STAR, US EPAof global energy goes to buildings and construction, which produce 34% of global CO2 emissions.
UNEP GlobalABC, 2024/2025per metric ton of CO2e over the limit: the penalty under NYC Local Law 97, whose limits tighten again in 2030.
NYC Department of BuildingsGrid, solar and generators on one side; HVAC, lighting, plug and process loads on the other. When the two stop adding up, or a feeder draws more than its weather-adjusted baseline, EnergySmart shows where and since when.
Utility supply, solar, generators, the main switchboard and every feeder, color coded by power factor and loading. A power triangle and 24-hour demand for any node you select.
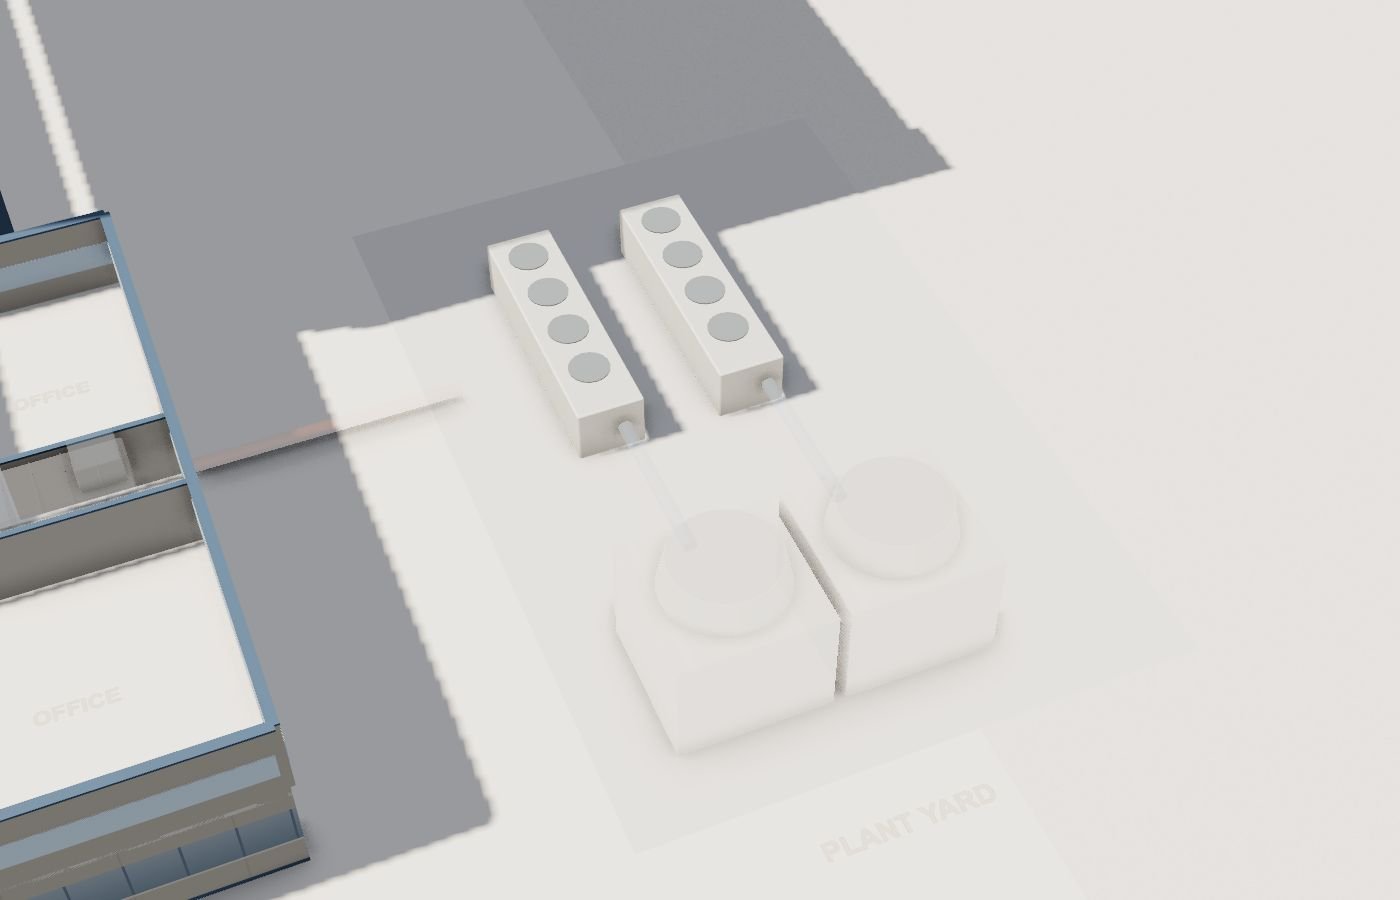
See when the site draws the most and sequence the big loads so they do not all start at once. Batteries, solar and backup generation can be scheduled against the curve.
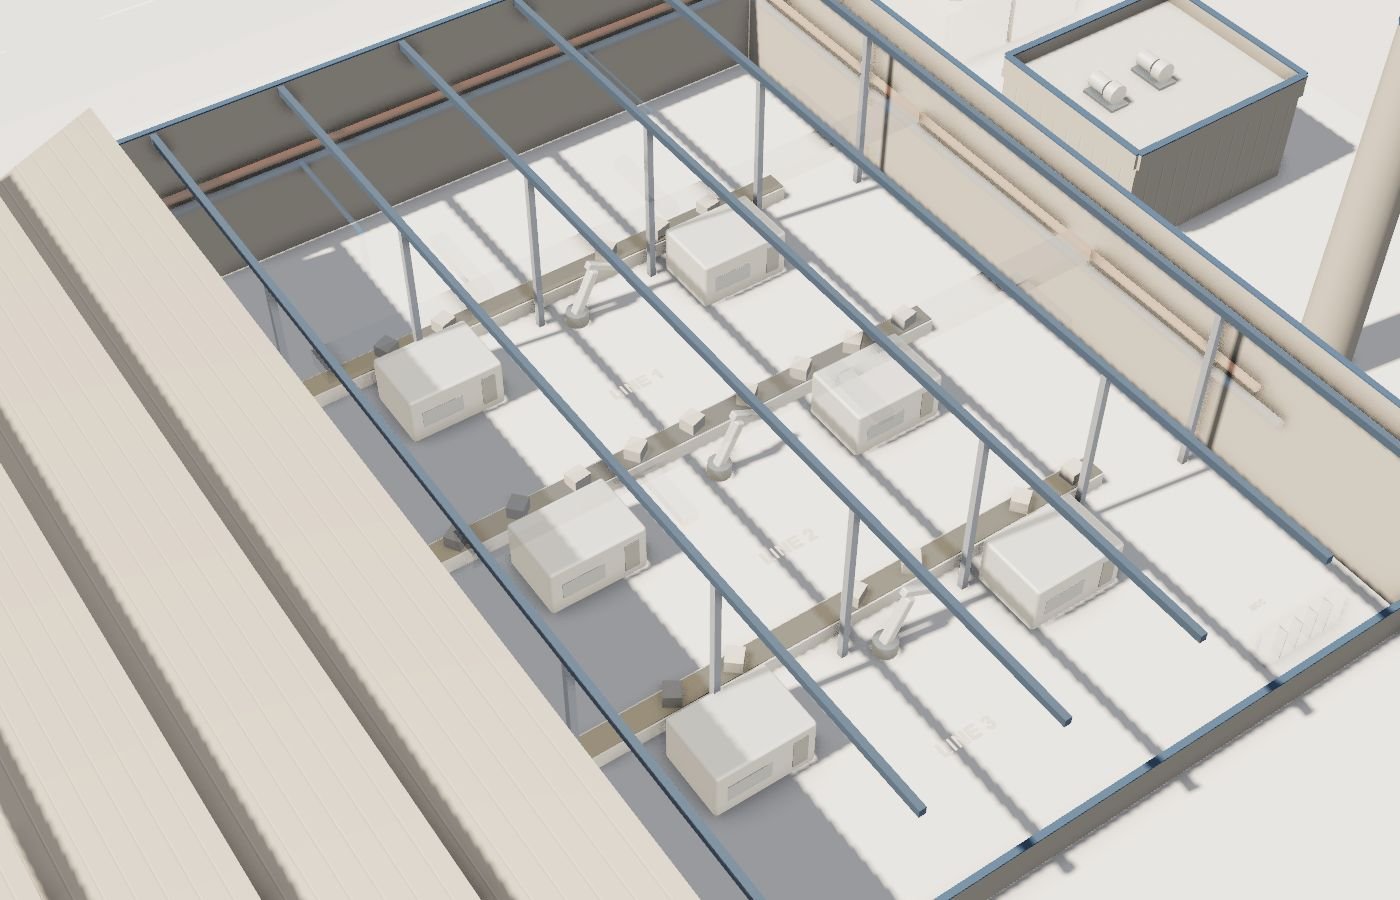
One utility meter and a monthly bill
Every source and feeder metered and color coded by load and power factor
Savings claimed against last year, whatever the weather
Savings measured against a baseline adjusted for heating and cooling degree days
Peaks discovered on the bill
Peak demand seen as it builds, with big loads sequenced so they do not start together
Supplier bills paid as issued
Each bill checked against your own meters, separating usage changes from rate changes
The recast EPBD requires the worst-performing 16% of non-residential buildings to be renovated by 2030, and the worst 26% by 2033. Member states had to adopt it by May 2026.
European Commission, EPBDGlobal electricity demand rose 4.3% in 2024 and is forecast to grow close to 4% a year to 2027, driven partly by data centres and air conditioning.
IEA, Electricity 2025Data centres used about 415 TWh in 2024 and are projected to need about 945 TWh by 2030, competing with buildings for the same grid capacity.
IEA, Energy and AI, 2025Track emissions against the limit from metered data, not a year-end estimate, and see which systems move the number.
Weather-normalized baselines follow IPMVP Option C for the whole facility and the regression approach in ASHRAE Guideline 14.
Energy information systems alone delivered median savings of 4% across about 6,000 buildings in DOE's campaign; control on top goes further.
US DOE and LBNL, 2019Sub-metered feeders turn shared electricity into measured recharges.
Energy results from live sites.
energy savings customers see.
commercial real estate portfolio client.
Usually only on some feeders. aQ EnergySmart starts with the main meter, existing sub-meters and BMS points, then a survey shows which feeders must be metered before sources equal loads plus losses. Feeder meters are what turn a single total into an explanation. See electricity meters.
Upload six to twelve months of utility bills and aQ EnergySmart fits a regression of usage against cooling and heating degree days for the site. Each month is then compared with that expected use, and the rate configuration from the bills turns the difference into money. Read about the weather-normalized baseline.
Yes, where control is enabled, with owner approval. Smart Controls switches simple loads through LoRaWAN relays and sends schedules and setpoints to chillers and air handlers over BACnet or Modbus. Every command is logged with whether it executed. See peak demand management.
Yes. aQ EnergySmart shows power factor and loading against rated kVA for every metered feeder, with a power triangle of kW, kVAR and kVA. A low power factor means paying for current that does no useful work, and the reactive penalty is shown on the twin. Read about power factor.
Yes. aQ EnergySmart handles electricity by default and gas in therms or cubic meters, so both volume and energy content can be reported. Gas use gets the same weather-normalized baseline and cost conversion as electricity, which matters most for boilers and space heating. See gas meters.
Bring a site, a utility bill or a question. We will show you where the loss is.