Best energy management system for universities
 Milvian AI teamFacilities and infrastructure intelligence
A university EMS should meter the central plant and the biggest buildings, then baseline each against weather and the academic calendar. That turns a climate commitment into a measured trajectory.
Where campus energy goes
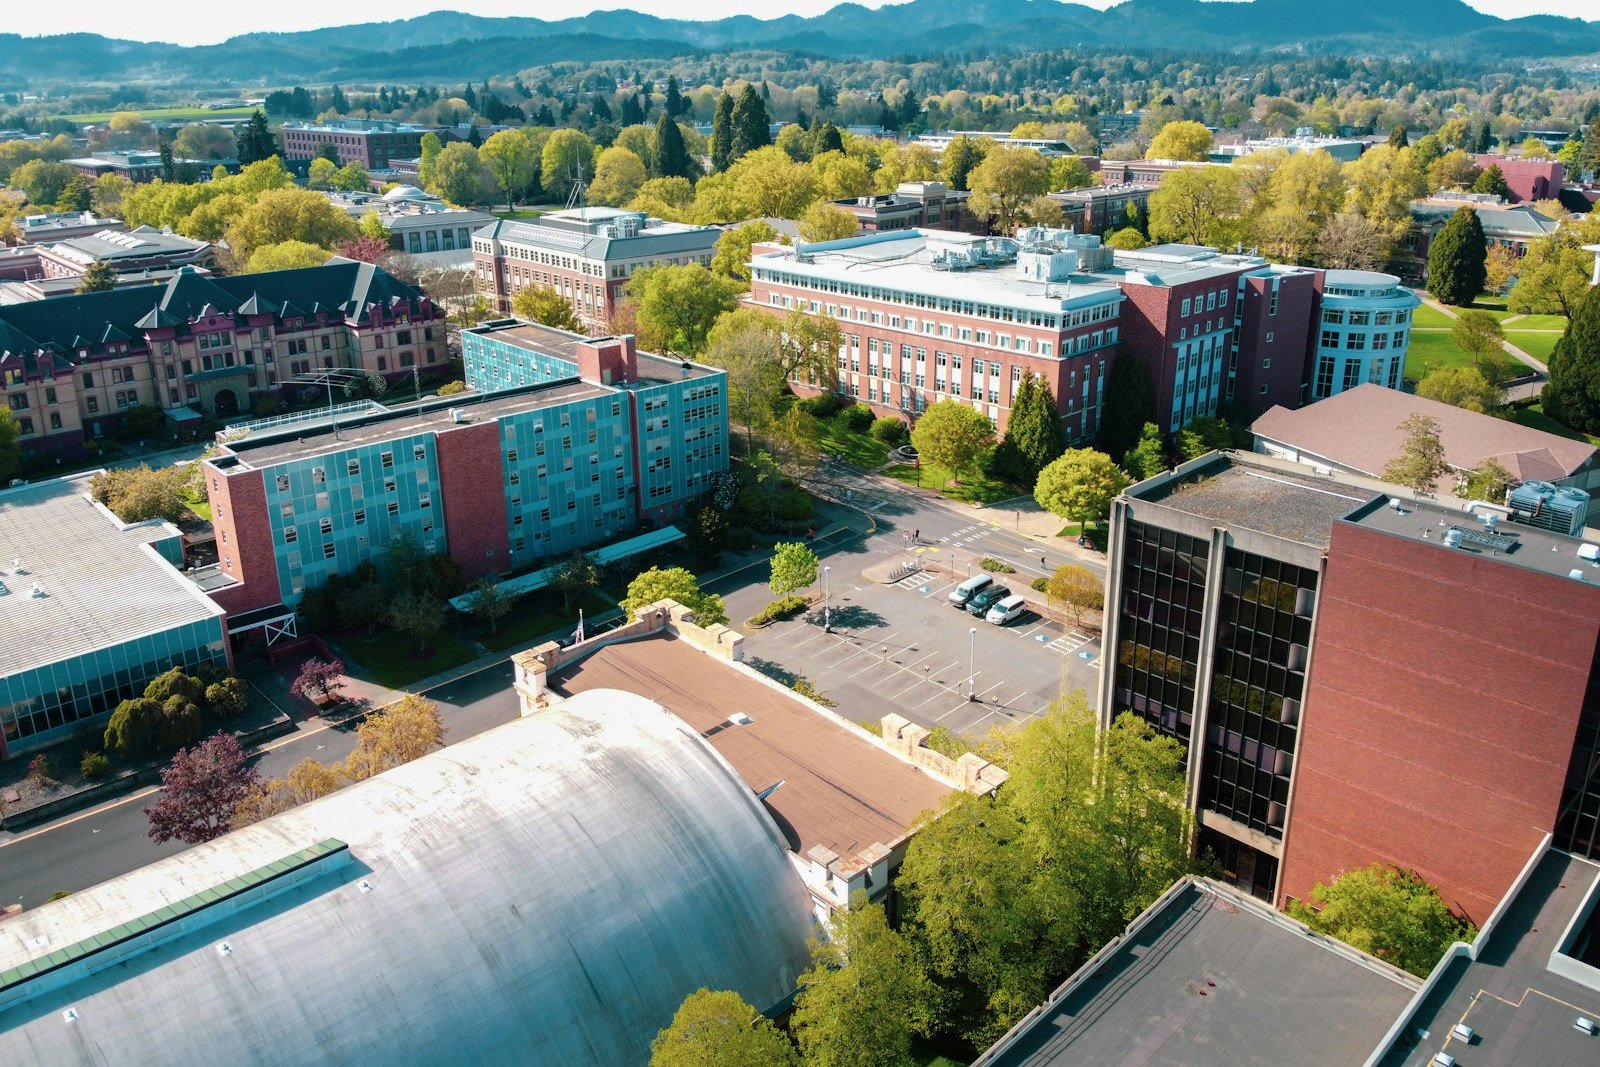
Many universities run a central plant that sends steam, hot water or chilled water to buildings through tunnels. The plant meters its fuel, but the buildings often have no thermal meters, so nobody knows which building uses what. Labs are usually the largest users per square foot because their air cannot be recirculated.
Heating dominates. EIA's 2018 survey found space heating took 42 percent of end-use energy in education buildings. Ventilation-heavy labs and residence halls running through breaks add to it.
What the EMS must do
| Requirement | Why it matters here | Ask the vendor |
|---|---|---|
| Meter thermal energy per building. | Central plants hide which building uses the heat. | Can you read BTU meters on steam and chilled water? |
| Baseline against the calendar. | Term time and breaks differ more than weather. | Can your baseline include occupancy periods? |
| Track labs on their own. | Labs often use far more energy per square foot. | Can you report lab buildings separately? |
| Report carbon by building. | Climate commitments need a building-level path. | Do you convert metered energy to emissions by fuel? |
Reporting and direction
Campuses report through ENERGY STAR Portfolio Manager, used for nearly 25 percent of US commercial floor space, and many have public climate commitments. Building performance standards reach universities in cities such as New York, where Local Law 97 covers buildings over 25,000 square feet. The DOE Smart Energy Analytics Campaign found median savings of 9 percent from fault detection and diagnostics.
How to evaluate one
- Read the plant firstFuel, steam and chilled water output.
- Meter the top ten buildingsLabs, hospitals and residence halls usually lead.
- Add the calendarInclude term dates in the baseline.
- Publish a rankingShare building performance with deans and budget holders.
Where Aqueduct fits
aQ EnergySmart reads plant and building meters and builds each building's expected use from bills and degree days, then turns the gap into money through rate configuration. The portfolio view ranks top improvers and buildings that need attention. aQ AirSafe adds air quality, so ventilation savings never come at the expense of classrooms or labs.
Sources
| Source | Link |
|---|---|
| US EIA, CBECS 2018, Education buildings | eia.gov |
| ENERGY STAR, Benchmark your building | energystar.gov |
| NYC Department of Buildings, Local Law 97 | nyc.gov |
| US DOE, Smart Energy Analytics Campaign | energy.gov |