Best energy management system for manufacturing
 Milvian AI teamFacilities and infrastructure intelligence
A manufacturing EMS should report energy per unit produced, line by line. It should also find the waste in compressed air, cooling and idle running, and manage peak demand and power factor.
Where plant energy goes
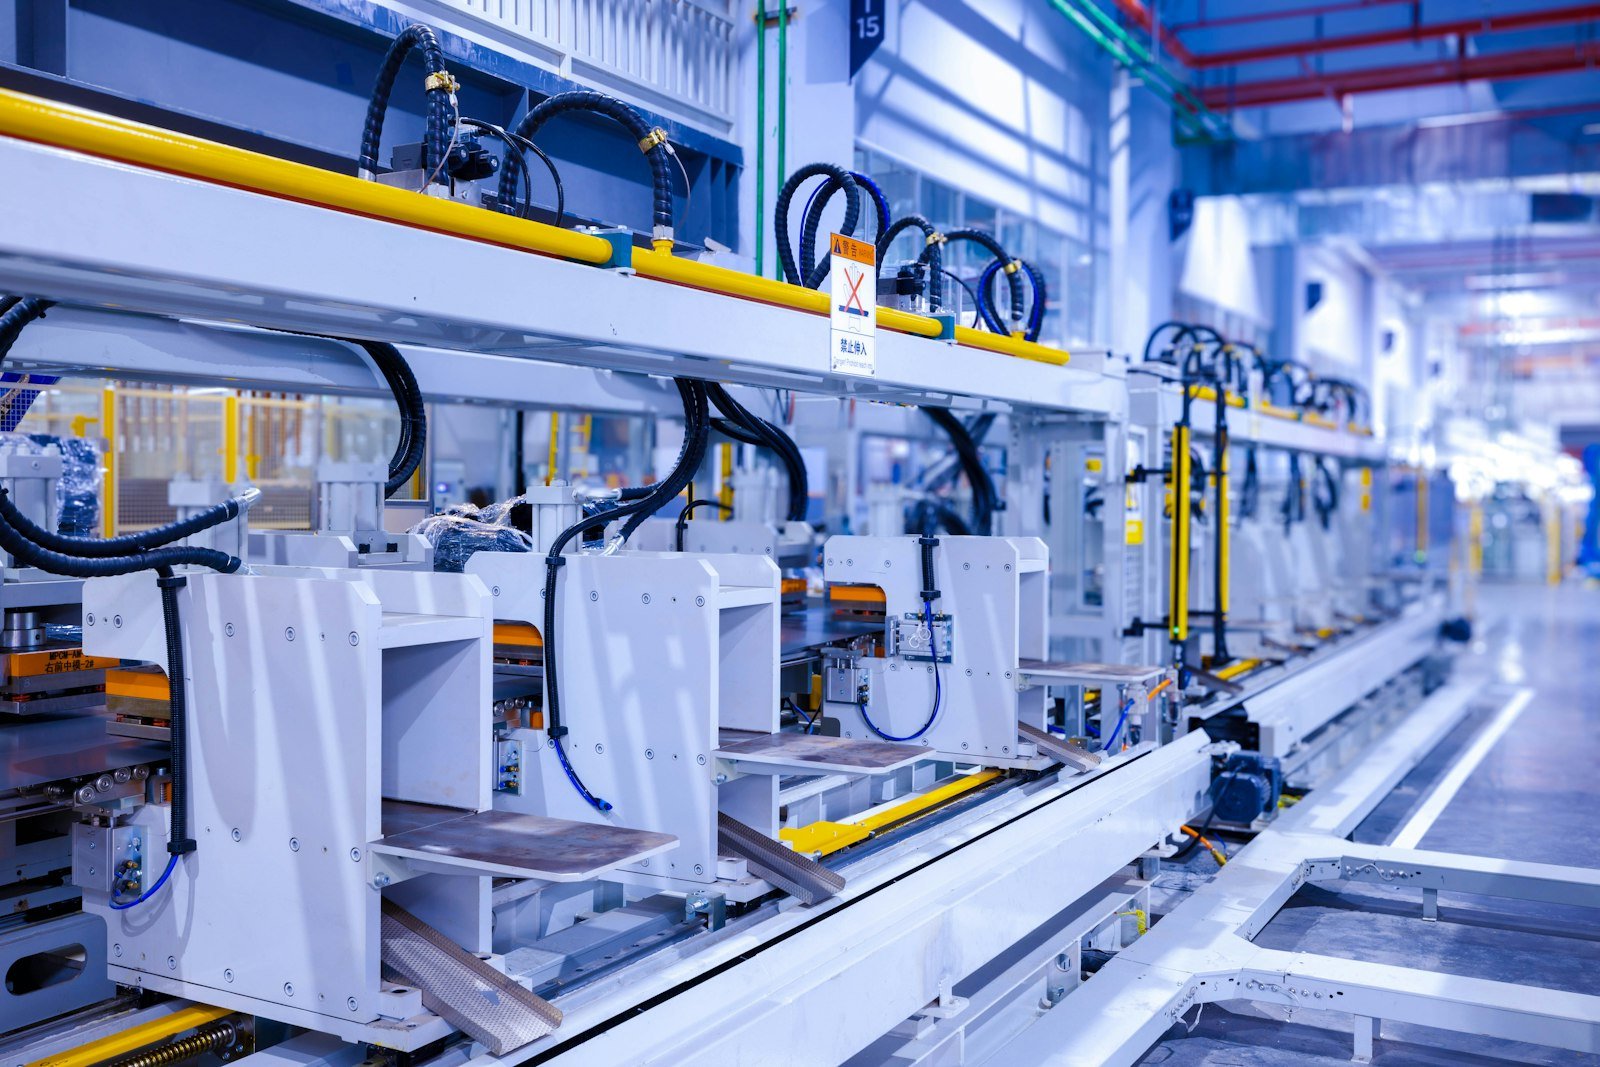
In most plants the big loads are motors: compressors, pumps, fans and chillers, plus process heat from boilers and furnaces. Much of the waste is time-based rather than technical, equipment running through breaks, weekends and changeovers.
Power quality adds hidden cost. When current and voltage drift out of phase, apparent power rises and a plant pays for capacity it does not use, and many tariffs penalize a low power factor directly.
ENERGY STAR estimates commercial buildings and industrial plants together use half of US energy, and often 30 percent or more of it is wasted.
What the EMS must do
| Requirement | Why it matters here | Ask the vendor |
|---|---|---|
| Report energy per unit. | Totals rise when production rises; intensity shows efficiency. | Can you import production counts and report kWh per unit? |
| Sub-meter lines and utilities. | A plant-level meter hides which line drifted. | Which feeders would you meter first? |
| Track power factor and demand. | Penalties and peak charges are avoidable costs. | Do you show power factor and kVA by feeder? |
| Show idle load. | Breaks and weekends reveal what should be off. | Can you report consumption during non-production hours? |
Standards and where this is going
ISO 50001 requires an energy baseline, energy performance indicators and evidence of improvement, which is exactly what metered intensity provides. Europe's ESRS reporting asks large manufacturers for energy and water by site. Global electricity demand rose 4.3 percent in 2024 according to the IEA, and plants competing with data centers and electrification for grid capacity will feel it in demand charges.
How to evaluate one
- Link meters to productionAgree how output data reaches the EMS.
- Meter the five biggest loadsCompressors, chillers, boilers, furnaces and the largest line.
- Measure a weekendIdle load is the fastest first saving.
- Set the baselineUse bills, weather and production to model expected use.
Where Aqueduct fits
aQ EnergySmart balances grid, solar and generator supply against every feeder in a live single-line twin, with power factor, loading against rated kVA and peak demand per node. Load sequencing keeps large motors from starting together, and baselines use past bills, degree days and production. Gas is tracked in therms or cubic meters alongside electricity.
Sources
| Source | Link |
|---|---|
| ENERGY STAR, About ENERGY STAR for buildings | energystar.gov |
| IEA, Electricity 2025 | iea.org |